If you would like to see and play with the interactive version of these graphs you can find them at
https://github.com/MCurve7/mcurve7_cfb/tree/main/RBR/2023
You just need to download the Alabama_(year)_regular_wk??_(opponent).html file and open it in a web browser.
If you can't dominate them throughout the game,
then ripping their hearts out at the last moment is the next best thing...
especially on the 10th anniversary of the that game.
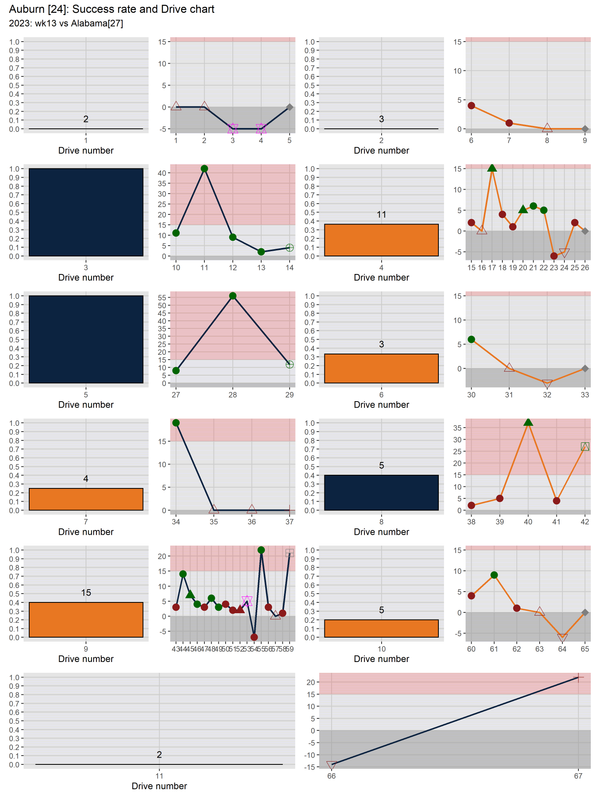
I've been looking at these graphs and numbers
and they just don't make sense to me with what we saw on the field.
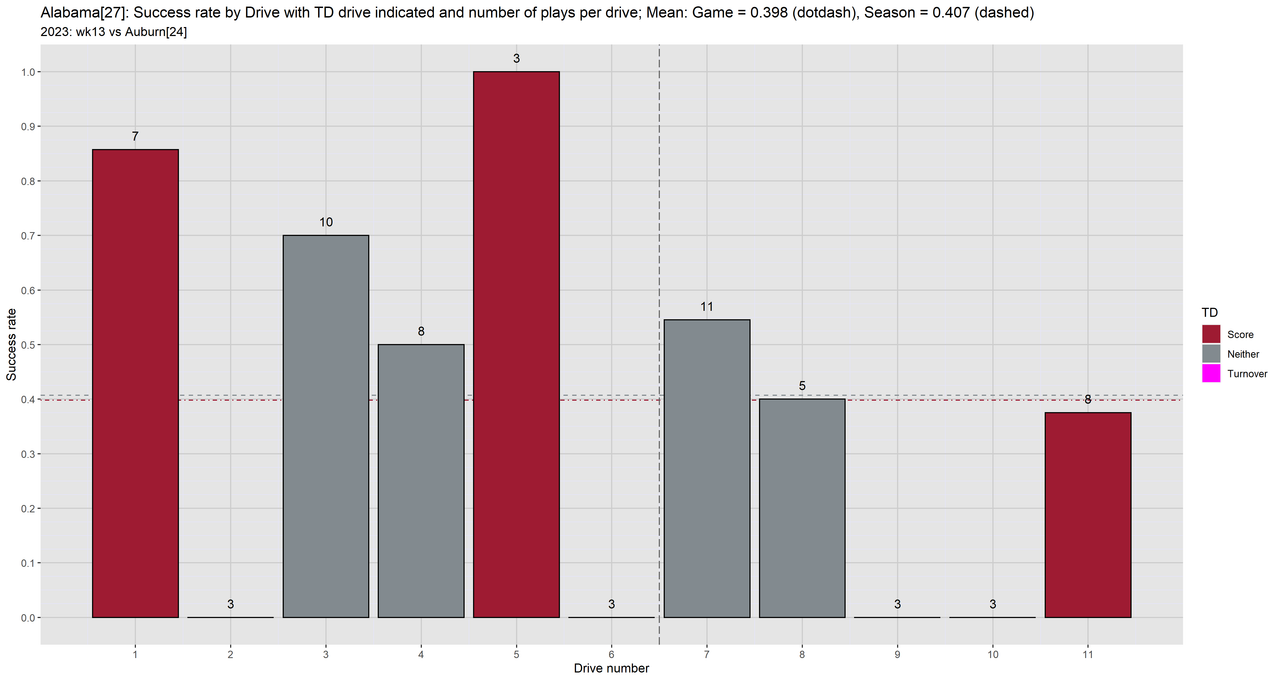
The SR by Drive mean was 0.398 which was closer to what we saw mid-season,
but was smaller than the SR of 0.484.
So maybe this difference is measuring an inconsistency in a teams performance.
There were 4 drives with a SR of 0.
Our mean season SR is 0.449 so this game's SR of 0.484 is just a bit higher (z = 0.457).
And our XR of 0.141 is just a bit below the mean season XR of 0.150, z = -0.280.
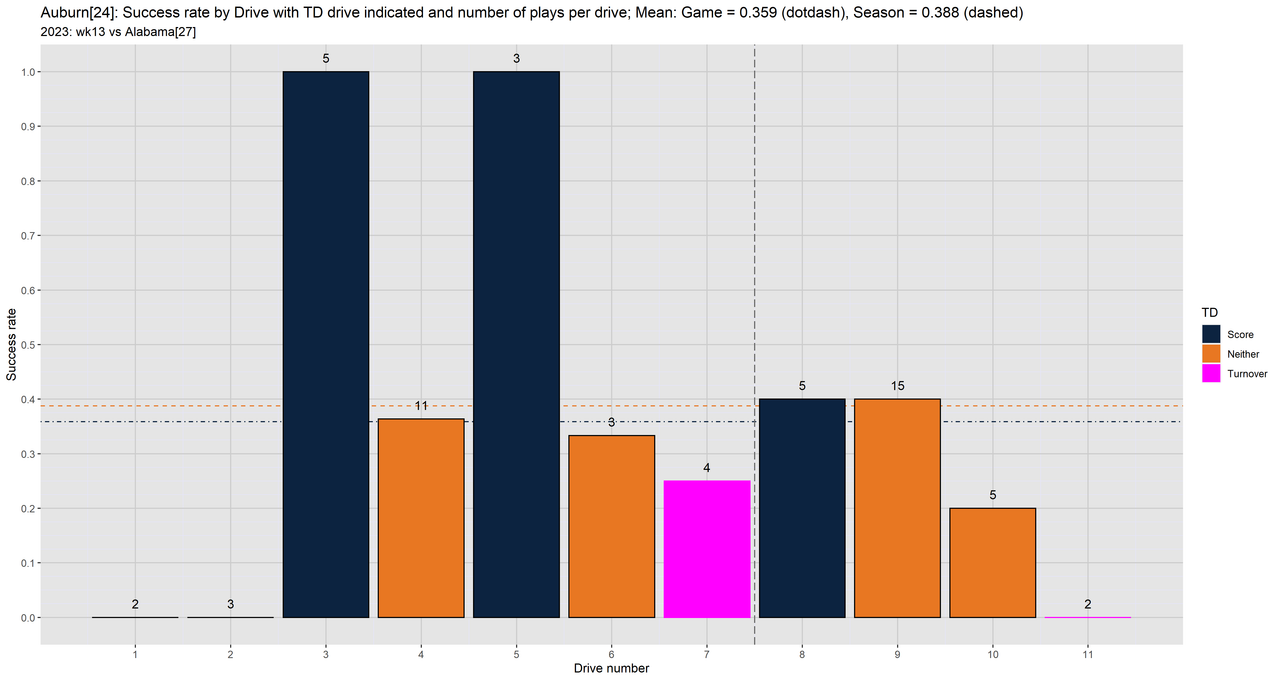
As for Auburn they had a SR of 0.397 vs a season mean of 0.431 giving a z = -0.286,
but their XR was 0.121 vs season mean of 0.088 giving a whopping z = 1.140!
As many have stated the explosive plays can really make up for an otherwise poor performance.
Success by drive: Alabama, 2023, week 13, season regular, Opponent: Auburn
| 1 |
7 |
6 |
1 |
0.857143 |
Score |
| 2 |
3 |
0 |
3 |
0.0 |
Neither |
| 3 |
10 |
7 |
3 |
0.7 |
Neither |
| 4 |
8 |
4 |
4 |
0.5 |
Neither |
| 5 |
3 |
3 |
0 |
1.0 |
Score |
| 6 |
3 |
0 |
3 |
0.0 |
Neither |
| 7 |
11 |
6 |
5 |
0.545455 |
Neither |
| 8 |
5 |
2 |
3 |
0.4 |
Neither |
| 9 |
3 |
0 |
3 |
0.0 |
Neither |
| 10 |
3 |
0 |
3 |
0.0 |
Neither |
| 11 |
8 |
3 |
5 |
0.375 |
Score |
Mean drive SR by week: Alabama, 2023
| wk01 |
0.545 |
0.562 |
0.141 |
Middle Tennessee |
| wk02 |
0.286 |
0.355 |
0.145 |
Texas |
| wk03 |
0.336 |
0.385 |
0.077 |
South Florida |
| wk04 |
0.362 |
0.446 |
0.123 |
Ole Miss |
| wk05 |
0.395 |
0.482 |
0.161 |
Mississippi State |
| wk06 |
0.312 |
0.344 |
0.148 |
Texas A&M |
| wk07 |
0.3 |
0.375 |
0.172 |
Arkansas |
| wk08 |
0.383 |
0.397 |
0.143 |
Tennessee |
| wk10 |
0.567 |
0.536 |
0.174 |
LSU |
| wk11 |
0.528 |
0.508 |
0.154 |
Kentucky |
| wk12 |
0.471 |
0.544 |
0.211 |
Chattanooga |
SR/XR: 2023, week 13, season regular: Alabama vs Auburn
| Alabama |
0.484 |
0.141 |
| Auburn |
0.397 |
0.121 |

Success by drive: Auburn, 2023, week 13, season regular, Opponent: Alabama
| 1 |
2 |
0 |
2 |
0.0 |
Neither |
| 2 |
3 |
0 |
3 |
0.0 |
Neither |
| 3 |
5 |
5 |
0 |
1.0 |
Score |
| 4 |
11 |
4 |
7 |
0.363636 |
Neither |
| 5 |
3 |
3 |
0 |
1.0 |
Score |
| 6 |
3 |
1 |
2 |
0.333333 |
Neither |
| 7 |
4 |
1 |
3 |
0.25 |
Turnover |
| 8 |
5 |
2 |
3 |
0.4 |
Score |
| 9 |
15 |
6 |
9 |
0.4 |
Neither |
| 10 |
5 |
1 |
4 |
0.2 |
Neither |
| 11 |
2 |
0 |
2 |
0.0 |
Turnover |
Mean drive SR by week: Auburn, 2023
| wk01 |
0.641 |
0.594 |
0.116 |
UMass |
| wk02 |
0.356 |
0.429 |
0.041 |
California |
| wk03 |
0.536 |
0.595 |
0.127 |
Samford |
| wk04 |
0.214 |
0.312 |
0.062 |
Texas A&M |
| wk05 |
0.389 |
0.391 |
0.078 |
Georgia |
| wk07 |
0.265 |
0.361 |
0.082 |
LSU |
| wk08 |
0.249 |
0.304 |
0.054 |
Ole Miss |
| wk09 |
0.387 |
0.484 |
0.113 |
Mississippi State |
| wk10 |
0.306 |
0.302 |
0.127 |
Vanderbilt |
| wk11 |
0.628 |
0.623 |
0.101 |
Arkansas |
| wk12 |
0.205 |
0.344 |
0.062 |
New Mexico State |
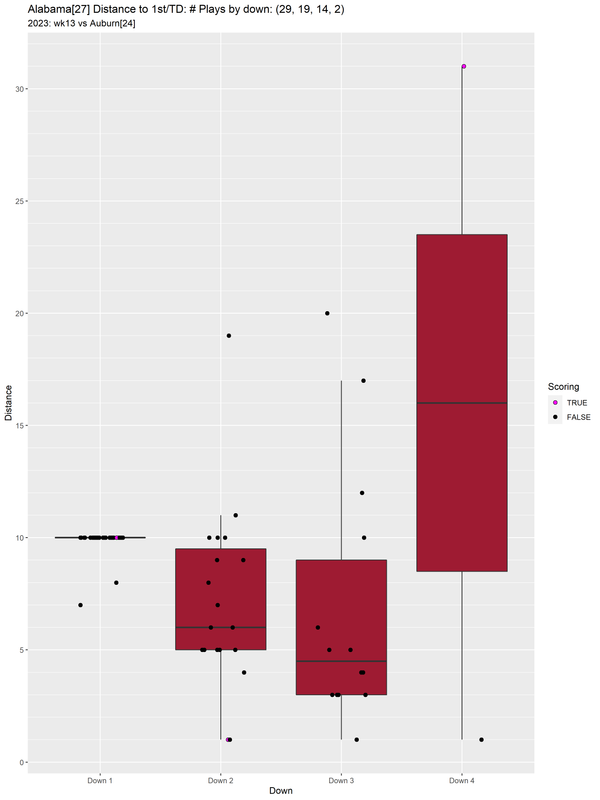
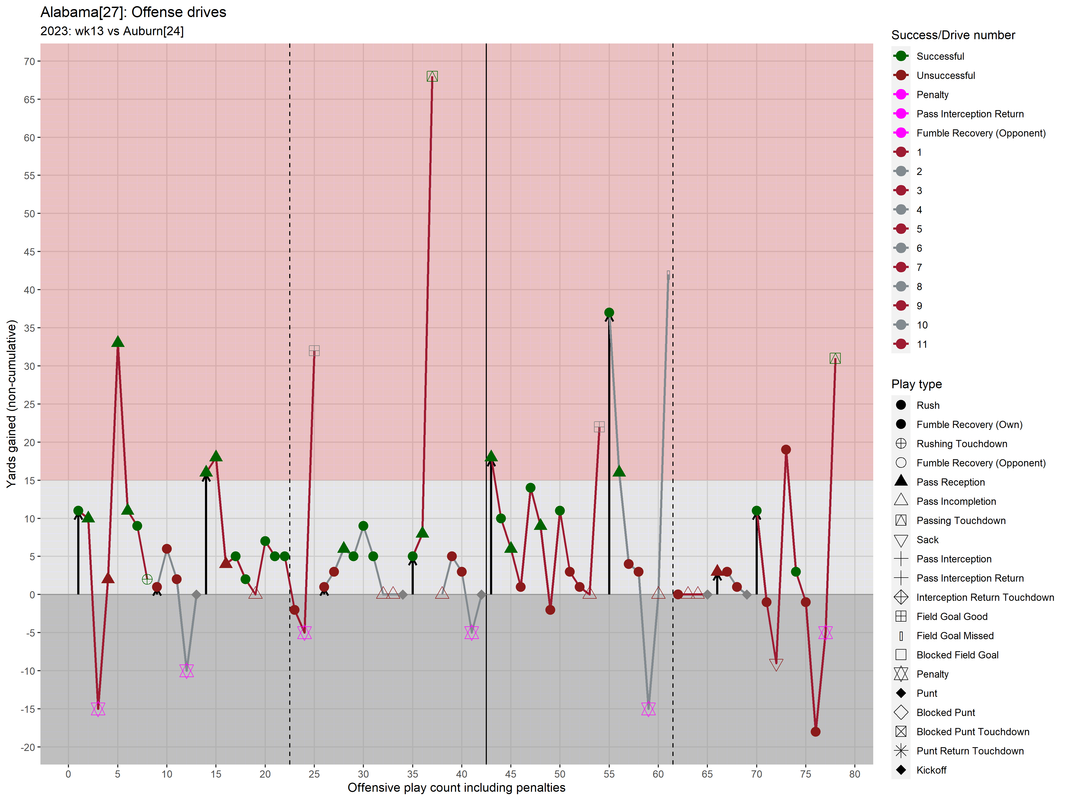
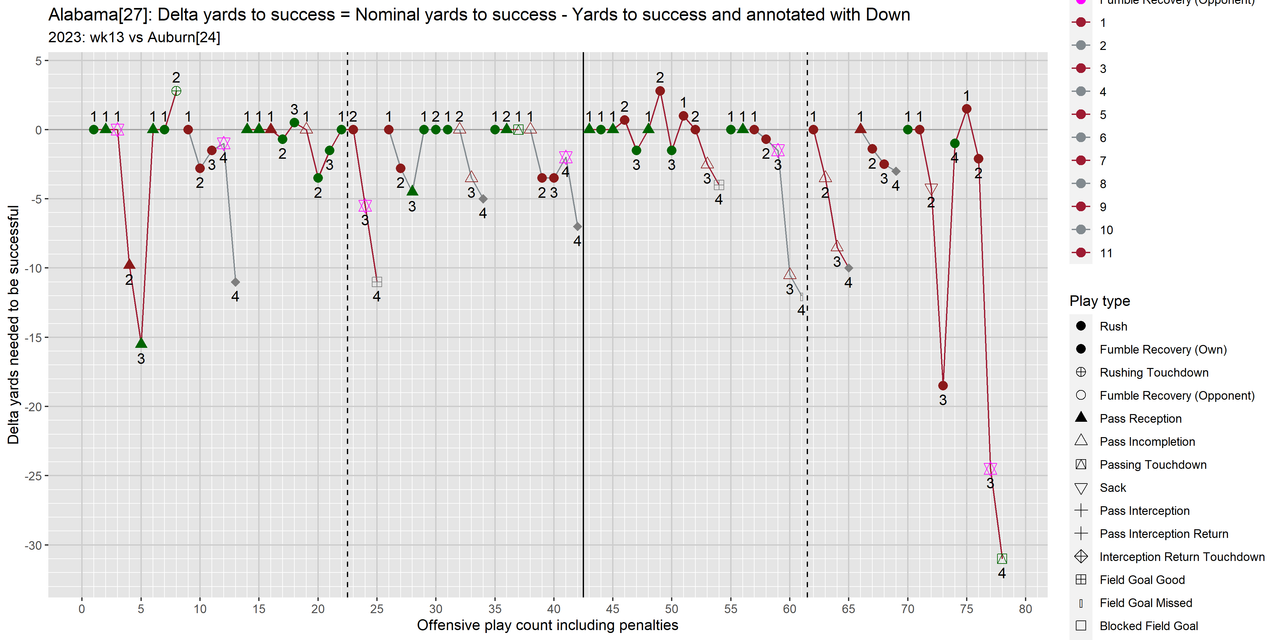
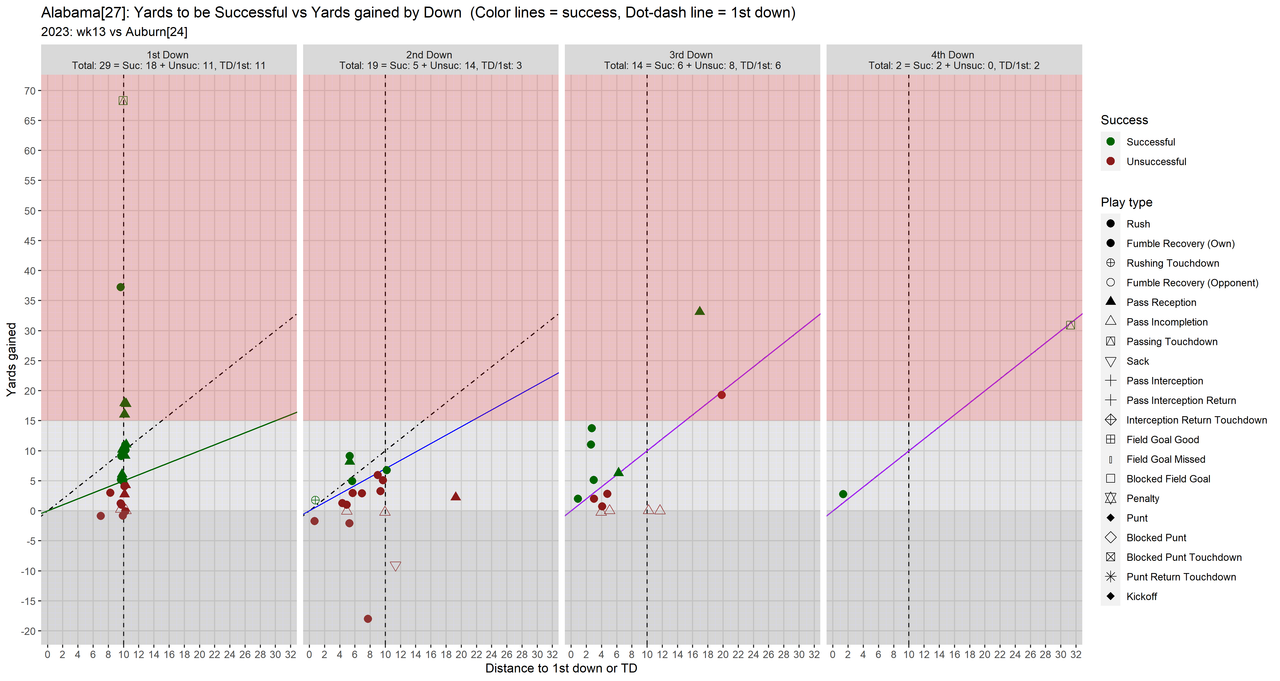
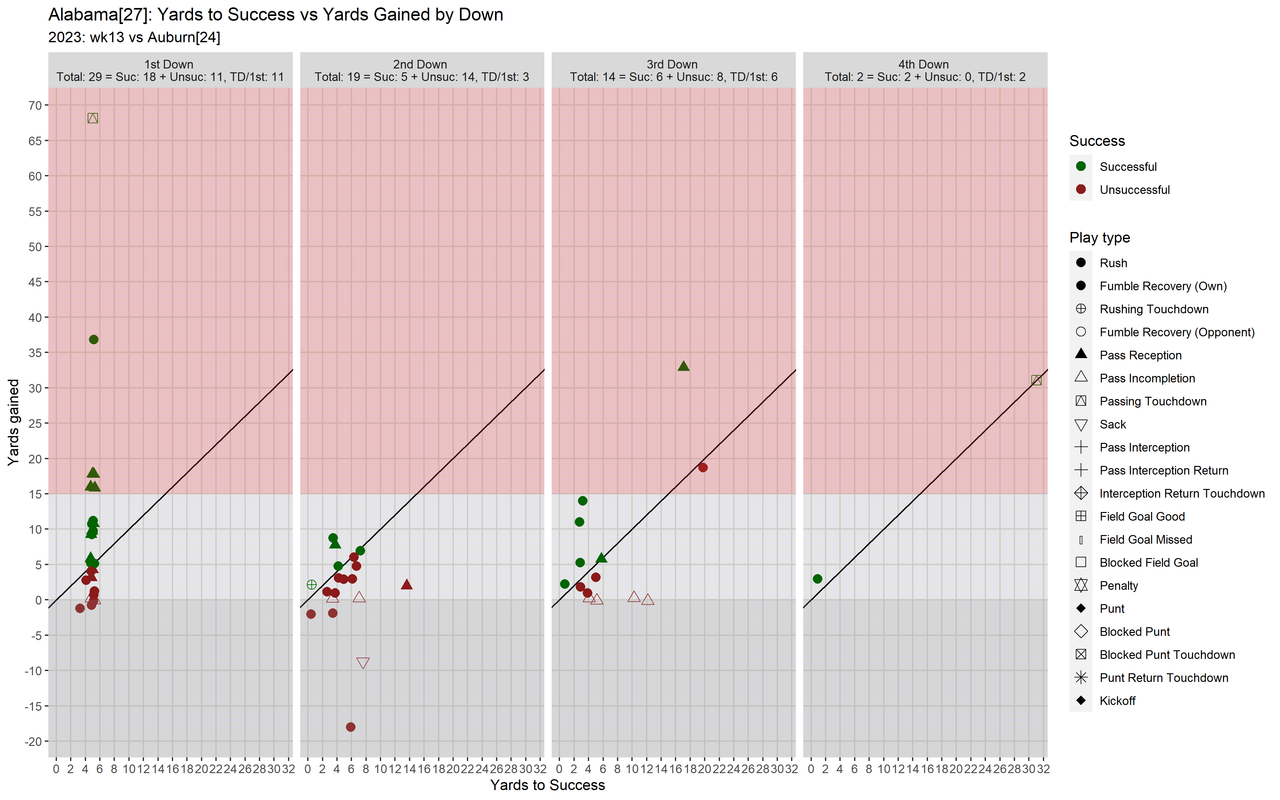
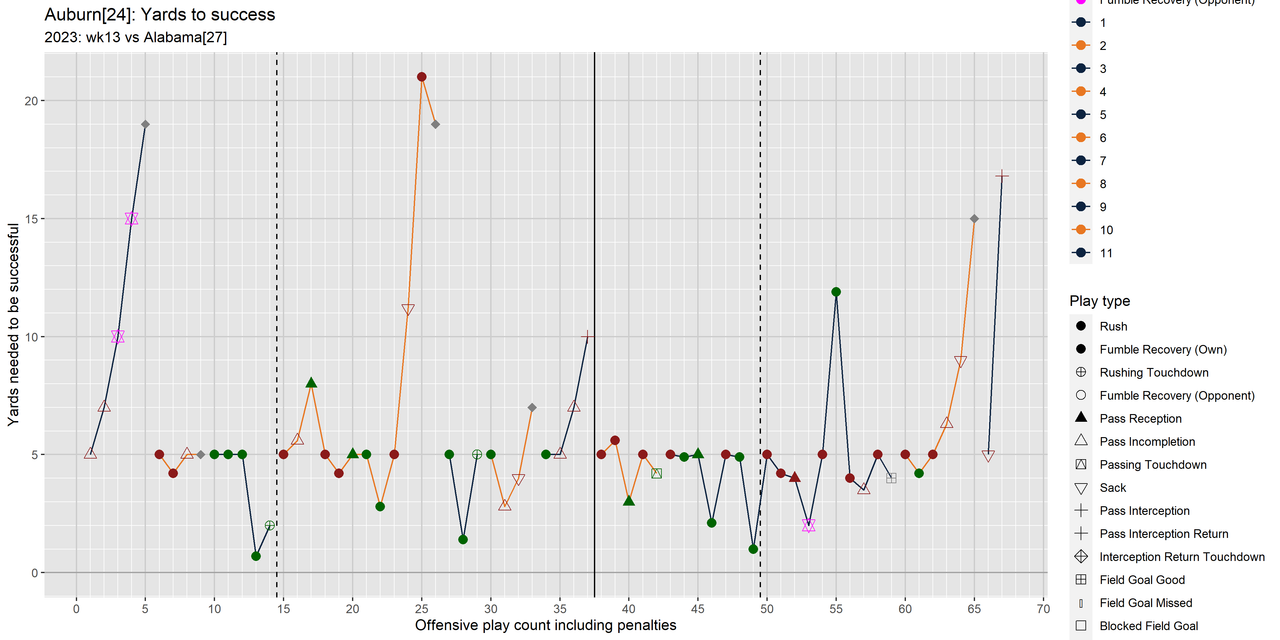
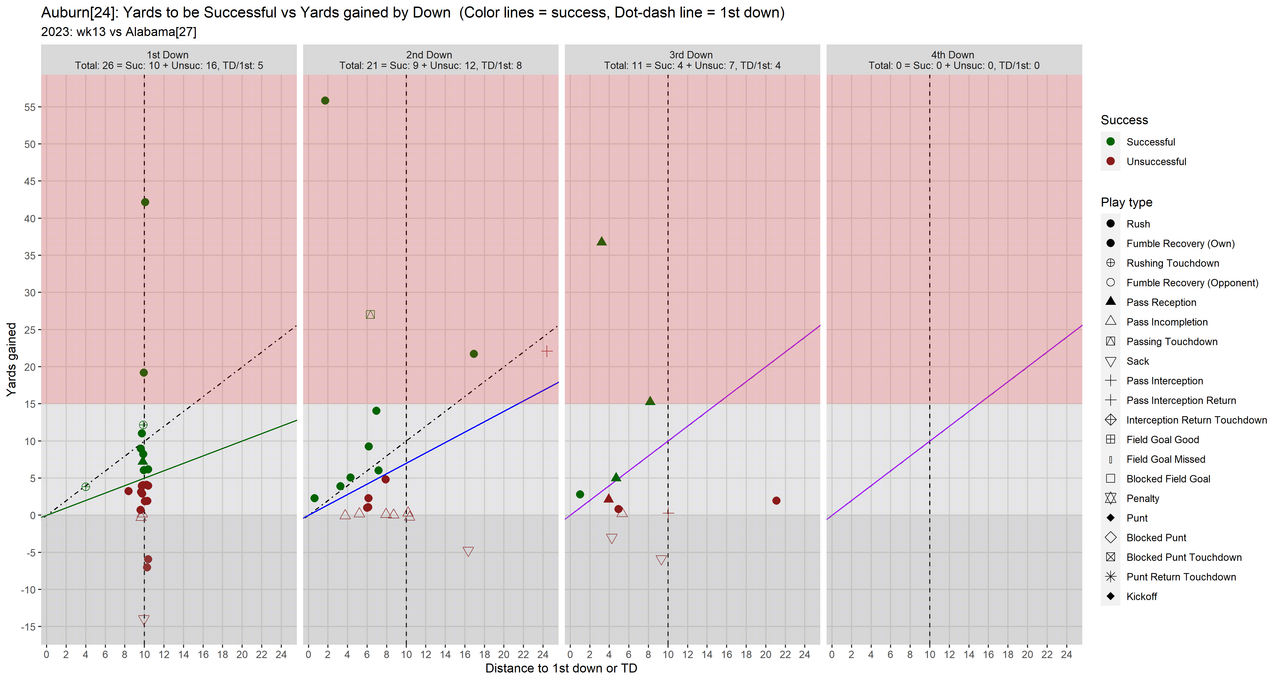
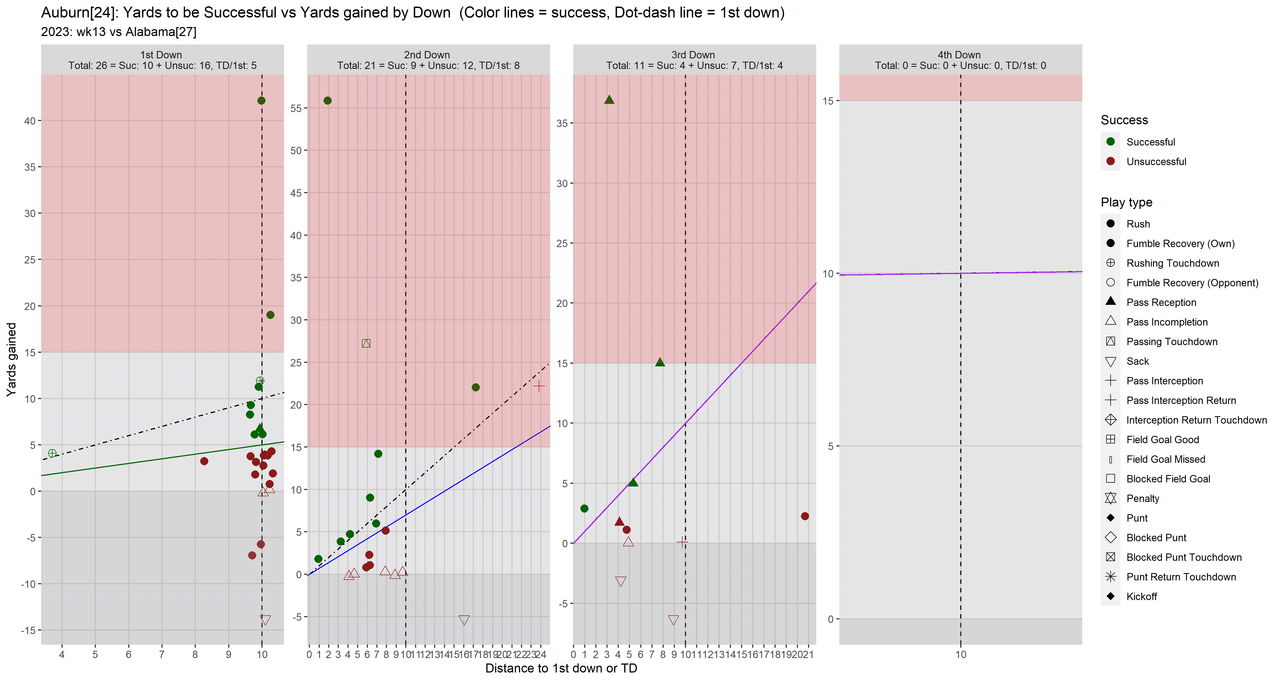
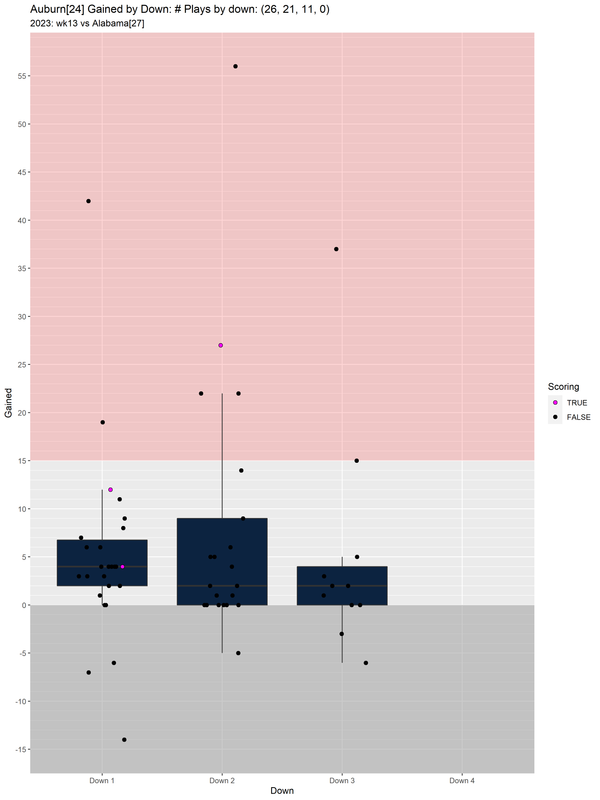
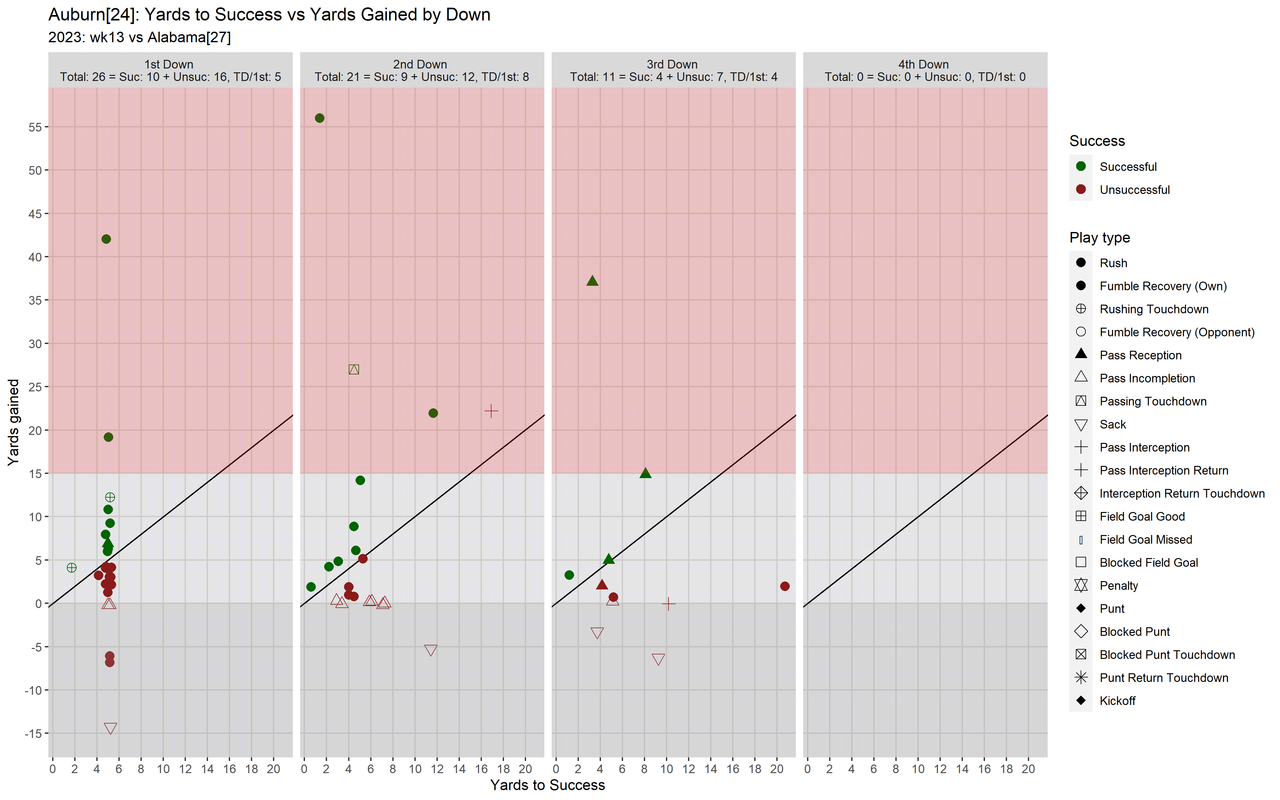
The Distance to 1st/TD, Yards gained table and the Yards to Success vs Yards gained graph look like what a good performance should look like
from my limited experience with these products.
I've seen "good performances" not show a decrease in the Mean/Median distances,
but I believe this is the first time I have seen this pattern for a bad game.
Distance to 1st/TD, Yards gained statistics by down: Alabama, 2023, week 13, season regular, Opponent: Auburn
| 1 |
29 |
0 |
9.82759 |
0.658405 |
10.0 |
9.7931 |
13.7409 |
5.0 |
| 2 |
19 |
10 |
7.15789 |
4.07244 |
6.0 |
1.26316 |
6.23469 |
2.0 |
| 3 |
14 |
5 |
6.85714 |
5.74934 |
4.5 |
6.85714 |
9.55838 |
2.5 |
| 4 |
2 |
12 |
16.0 |
21.2132 |
16.0 |
17.0 |
19.799 |
17.0 |
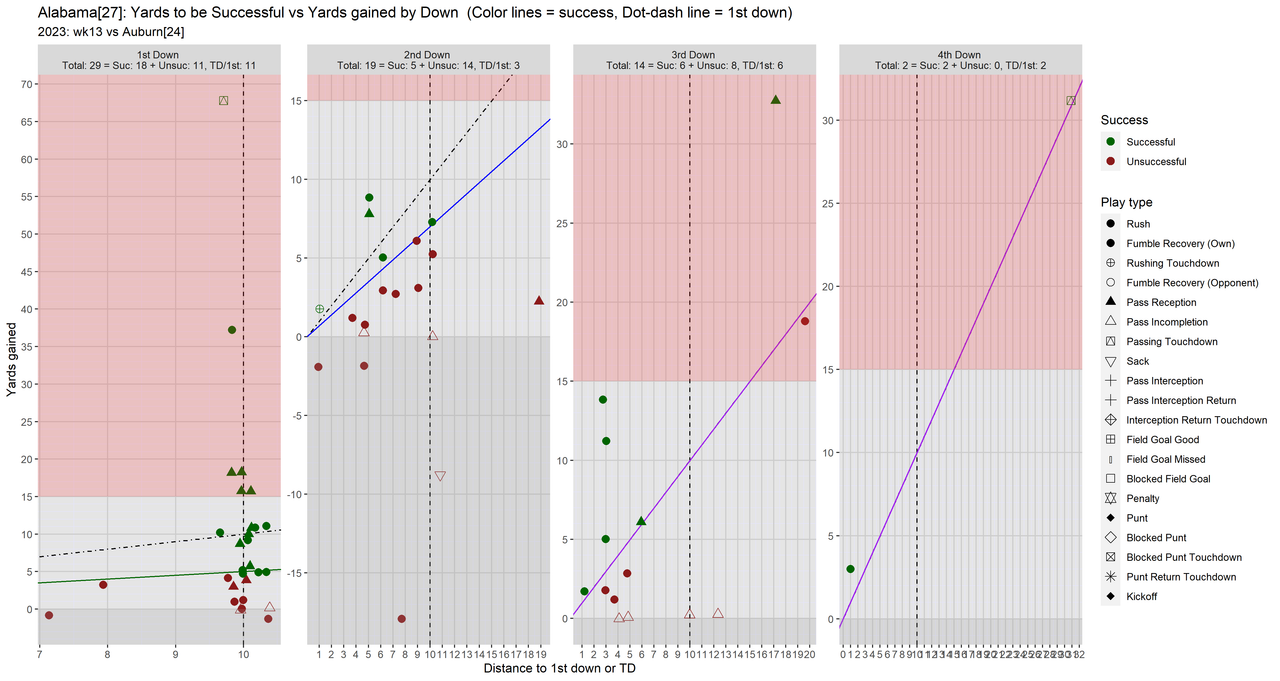
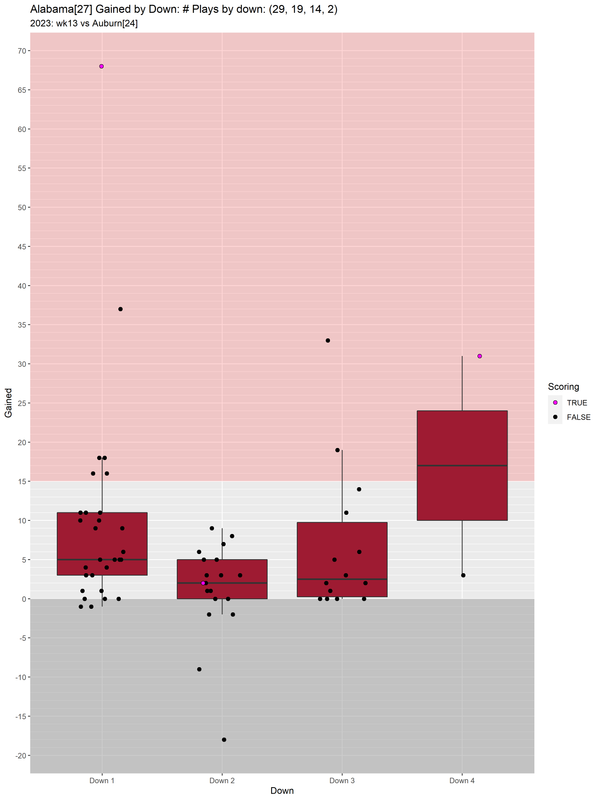
So what is happening?
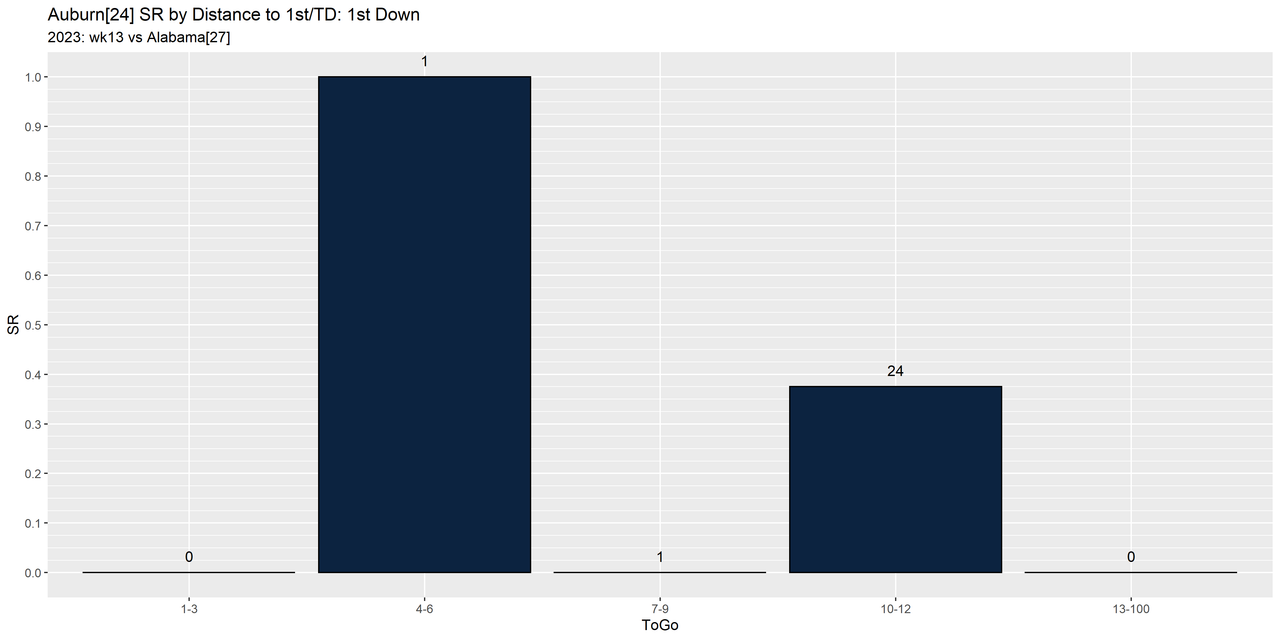
Looking at the Success by down table
and squinting so that you can just see the 1st downs looks pretty good, SR = 0.621.
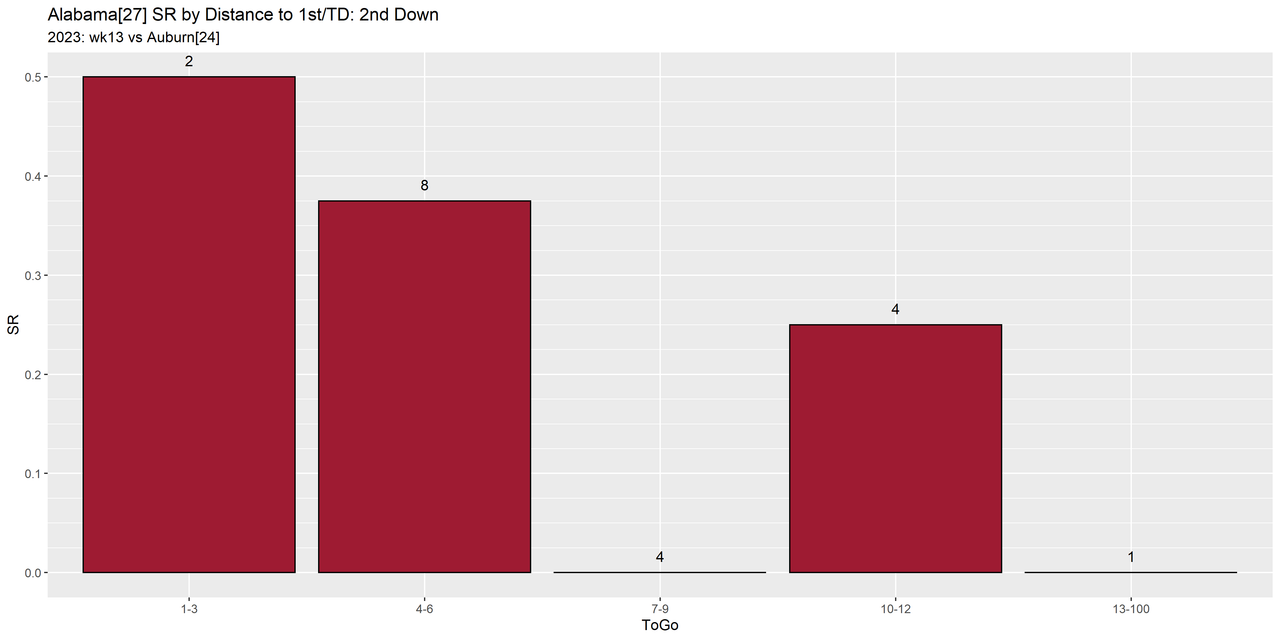
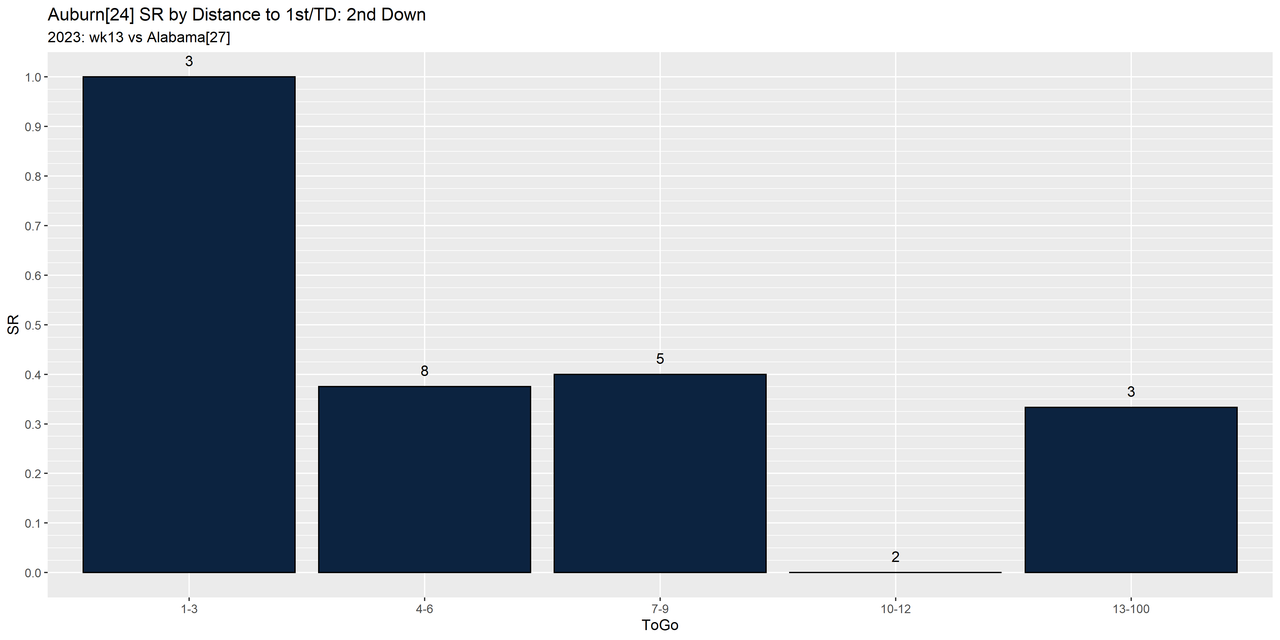
But our 2nd down performance was awful!
We had a SR of 0.263 because we were only successful on 5 of 19 attempts.
Of those 19 attempts 10 were from 1-6 yards from a 1st/TD which you'd like to think are makeable.
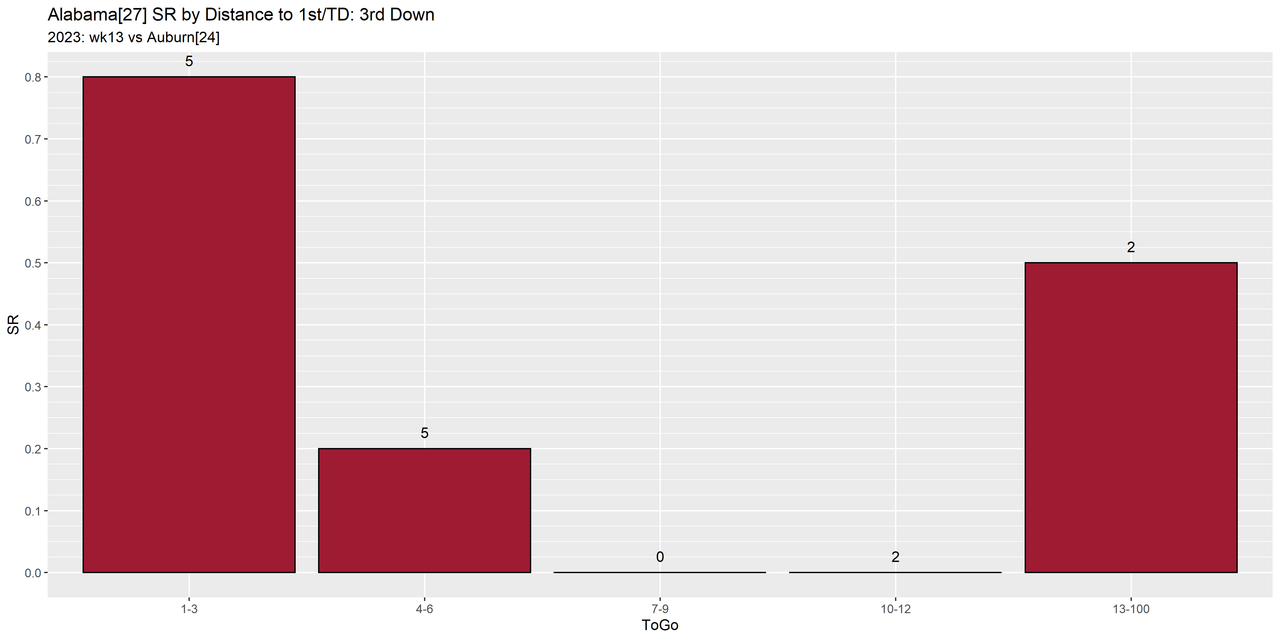
While third down was better,
6 out of 14,
for a SR of 0.429 that's still not great since 10 of those plays were from 1-6 yards out.
Actually we were pretty good from 1-3 yards out, SR = 0.8.
It was the 4-6 range that we had problems with, SR = 0.2.
Success by down: Alabama, 2023, week 13, season regular, Opponent: Auburn
| 1 |
18 |
11 |
29 |
11 |
| 2 |
5 |
14 |
19 |
3 |
| 3 |
6 |
8 |
14 |
6 |
| 4 |
2 |
0 |
2 |
2 |

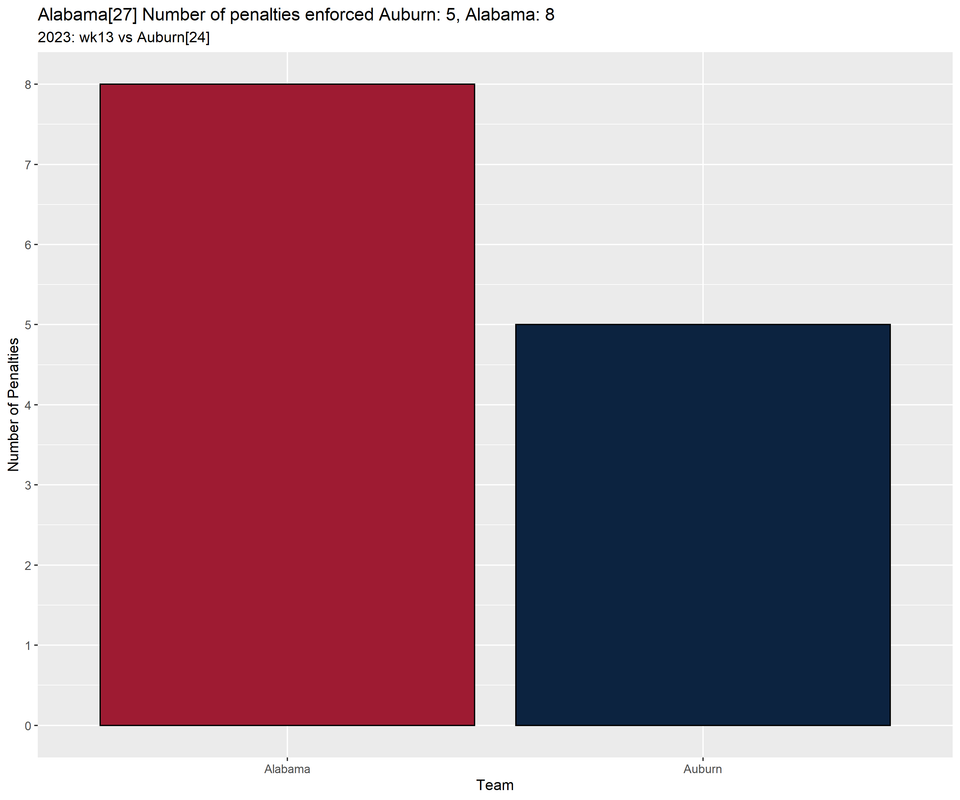
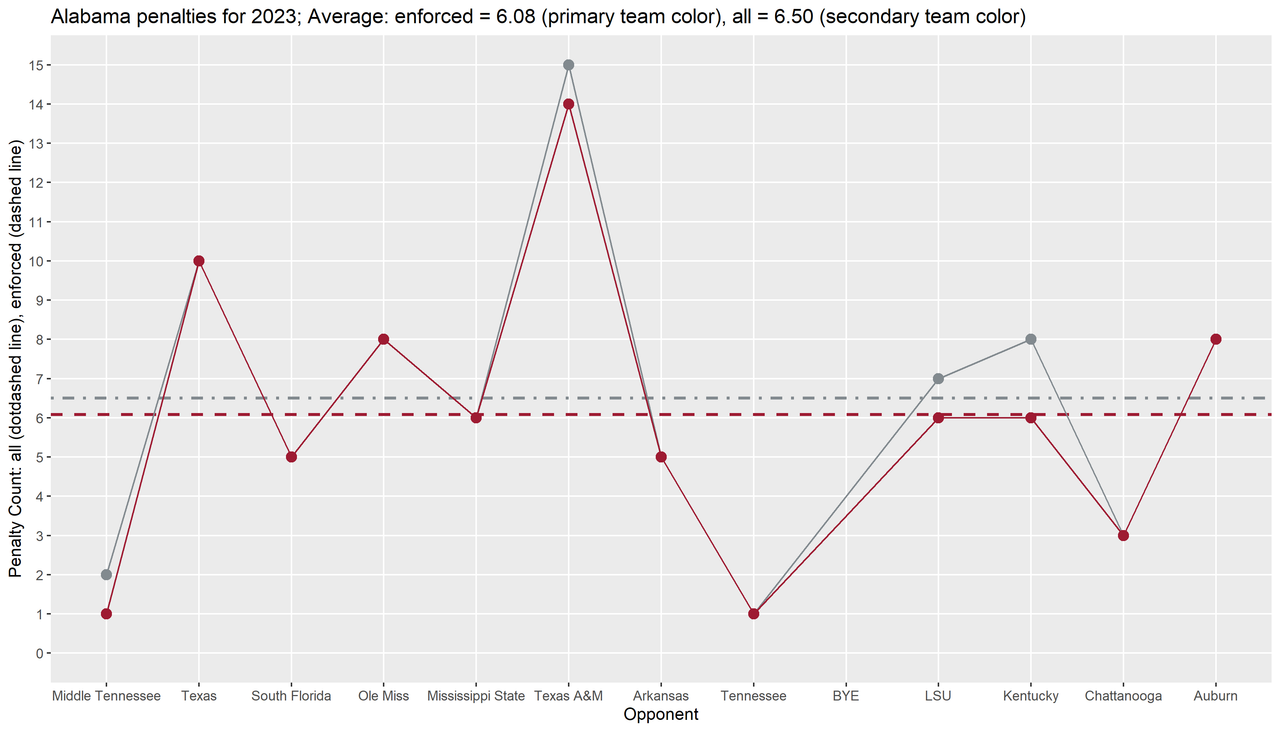
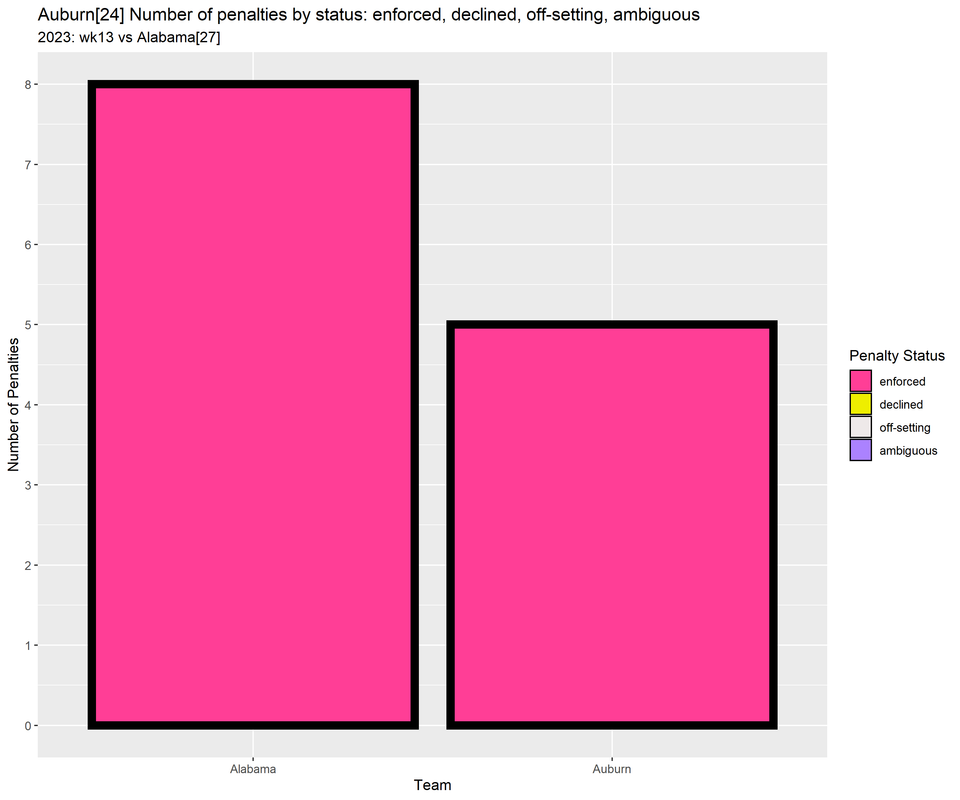
We had 8 penalties vs our season average of 6.08.
I need to keep track of whether these games are away or home games,
but a quick bit of work gives the table below.
We had 5 away games with an average of 7.8 penalties per game (median 6)
and 7 home games with an average of 4.7 penalties per game (median 5) including the 10 penalty game vs Texas.
So 8 penalties this week was just above our away game average
(I'm not going to acknowledge those ref existence and hope then cease to exist as a refs).
But I do believe I have found the rule that Auburn broke at 13:21 of the 4th quarter.
The rule 7.4.b.2 states that:
- Man in Motion.
-
The player who goes in motion may not start from the line of scrimmage unless they first become a back and come to a complete stop.
Number 86 lines up on the line of scrimmage
and then immediately goes into motion (at the same time that 87 does) without out first taking a step back and then coming to a complete stop.
Penalties: Sorted by away/home; week
| week |
Alabama |
Location |
Opponent |
| 3 |
5 |
A |
USF |
| 5 |
6 |
A |
Miss St |
| 6 |
14 |
A |
aTm |
| 11 |
6 |
A |
UK |
| 13 |
8 |
A |
Barn |
| 1 |
2 |
H |
MTSU |
| 2 |
10 |
H |
Texas |
| 4 |
6 |
H |
Ole Miss |
| 7 |
5 |
H |
Ark |
| 8 |
1 |
H |
Tenn |
| 10 |
6 |
H |
LSU |
| 12 |
3 |
H |
Chat |
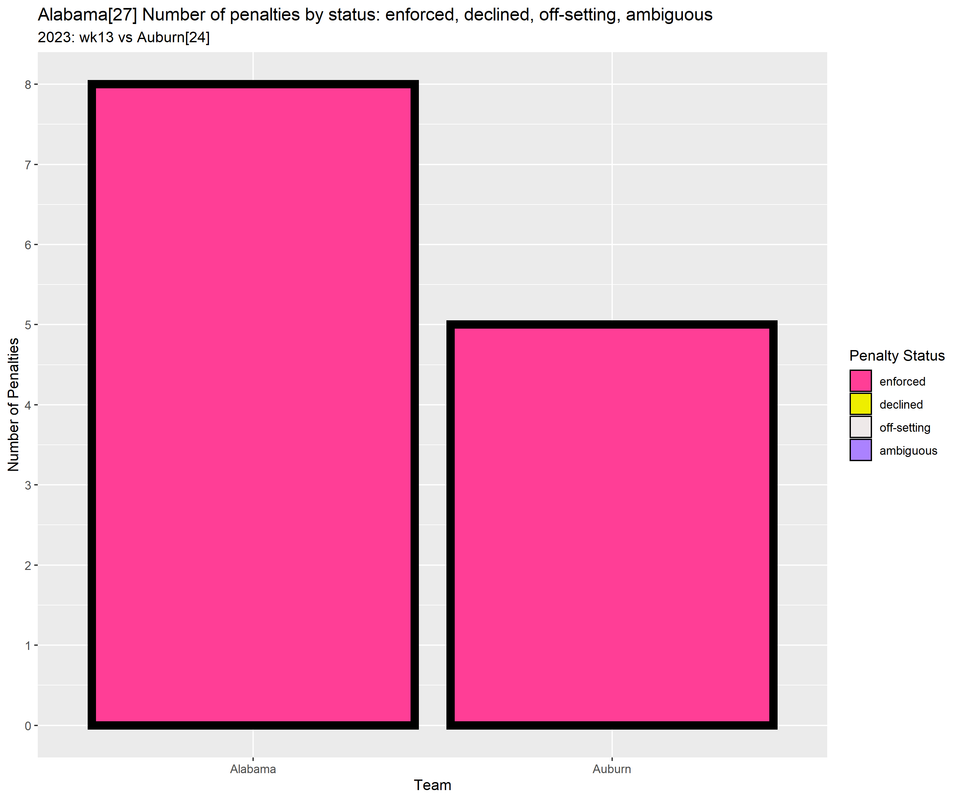
Penalties: 2023, week 13, season regular
| Alabama |
Personal Foul |
enforced |
| Alabama |
Holding |
enforced |
| Alabama |
Illegal Forward Pass |
enforced |
| Alabama |
Face Mask |
enforced |
| Alabama |
Delay Of Game |
enforced |
| Alabama |
Personal Foul |
enforced |
| Alabama |
Offsides |
enforced |
| Alabama |
Illegal Forward Pass |
enforced |
| Auburn |
False Start |
enforced |
| Auburn |
Illegal Forward Pass |
enforced |
| Auburn |
Block In The Back |
enforced |
| Auburn |
Offsides |
enforced |
| Auburn |
Block In The Back |
enforced |
On to Atlanta and Roll Tide!

Success by drive: Alabama, 2023, week 13, season regular, Opponent: Auburn
| 1 |
7 |
6 |
1 |
0.857143 |
Score |
| 2 |
3 |
0 |
3 |
0.0 |
Neither |
| 3 |
10 |
7 |
3 |
0.7 |
Neither |
| 4 |
8 |
4 |
4 |
0.5 |
Neither |
| 5 |
3 |
3 |
0 |
1.0 |
Score |
| 6 |
3 |
0 |
3 |
0.0 |
Neither |
| 7 |
11 |
6 |
5 |
0.545455 |
Neither |
| 8 |
5 |
2 |
3 |
0.4 |
Neither |
| 9 |
3 |
0 |
3 |
0.0 |
Neither |
| 10 |
3 |
0 |
3 |
0.0 |
Neither |
| 11 |
8 |
3 |
5 |
0.375 |
Score |
Mean drive SR by week: Alabama, 2023
| wk01 |
0.545 |
0.562 |
0.141 |
Middle Tennessee |
| wk02 |
0.286 |
0.355 |
0.145 |
Texas |
| wk03 |
0.336 |
0.385 |
0.077 |
South Florida |
| wk04 |
0.362 |
0.446 |
0.123 |
Ole Miss |
| wk05 |
0.395 |
0.482 |
0.161 |
Mississippi State |
| wk06 |
0.312 |
0.344 |
0.148 |
Texas A&M |
| wk07 |
0.3 |
0.375 |
0.172 |
Arkansas |
| wk08 |
0.383 |
0.397 |
0.143 |
Tennessee |
| wk10 |
0.567 |
0.536 |
0.174 |
LSU |
| wk11 |
0.528 |
0.508 |
0.154 |
Kentucky |
| wk12 |
0.471 |
0.544 |
0.211 |
Chattanooga |
SR/XR: 2023, week 13, season regular: Alabama vs Auburn
| Alabama |
0.484 |
0.141 |
| Auburn |
0.397 |
0.121 |


Success by down: Alabama, 2023, week 13, season regular, Opponent: Auburn
| 1 |
18 |
11 |
29 |
11 |
| 2 |
5 |
14 |
19 |
3 |
| 3 |
6 |
8 |
14 |
6 |
| 4 |
2 |
0 |
2 |
2 |
3rd down Successful/Unsuccessful: Alabama, 2023, week 13, season regular, Opponent: Auburn
| 1 |
27 |
Successful |
| 3 |
18 |
Successful |
| 3 |
19 |
Successful |
| 3 |
40 |
Successful |
| 3 |
42 |
Unsuccessful |
| 4 |
4 |
Unsuccessful |
| 4 |
76 |
Unsuccessful |
| 5 |
70 |
Unsuccessful |
| 5 |
70 |
Unsuccessful |
| 6 |
95 |
Successful |
| 10 |
75 |
Unsuccessful |
| 12 |
24 |
Unsuccessful |
| 17 |
55 |
Successful |
| 20 |
29 |
Unsuccessful |
Distance to 1st/TD, Yards gained statistics by down: Alabama, 2023, week 13, season regular, Opponent: Auburn
| 1 |
29 |
0 |
9.82759 |
0.658405 |
10.0 |
9.7931 |
13.7409 |
5.0 |
| 2 |
19 |
10 |
7.15789 |
4.07244 |
6.0 |
1.26316 |
6.23469 |
2.0 |
| 3 |
14 |
5 |
6.85714 |
5.74934 |
4.5 |
6.85714 |
9.55838 |
2.5 |
| 4 |
2 |
12 |
16.0 |
21.2132 |
16.0 |
17.0 |
19.799 |
17.0 |


Penalties: 2023, week 13, season regular
| Alabama |
Personal Foul |
enforced |
| Alabama |
Holding |
enforced |
| Alabama |
Illegal Forward Pass |
enforced |
| Alabama |
Face Mask |
enforced |
| Alabama |
Delay Of Game |
enforced |
| Alabama |
Personal Foul |
enforced |
| Alabama |
Offsides |
enforced |
| Alabama |
Illegal Forward Pass |
enforced |
| Auburn |
False Start |
enforced |
| Auburn |
Illegal Forward Pass |
enforced |
| Auburn |
Block In The Back |
enforced |
| Auburn |
Offsides |
enforced |
| Auburn |
Block In The Back |
enforced |

Success by drive: Auburn, 2023, week 13, season regular, Opponent: Alabama
| 1 |
2 |
0 |
2 |
0.0 |
Neither |
| 2 |
3 |
0 |
3 |
0.0 |
Neither |
| 3 |
5 |
5 |
0 |
1.0 |
Score |
| 4 |
11 |
4 |
7 |
0.363636 |
Neither |
| 5 |
3 |
3 |
0 |
1.0 |
Score |
| 6 |
3 |
1 |
2 |
0.333333 |
Neither |
| 7 |
4 |
1 |
3 |
0.25 |
Turnover |
| 8 |
5 |
2 |
3 |
0.4 |
Score |
| 9 |
15 |
6 |
9 |
0.4 |
Neither |
| 10 |
5 |
1 |
4 |
0.2 |
Neither |
| 11 |
2 |
0 |
2 |
0.0 |
Turnover |
Mean drive SR by week: Auburn, 2023
| wk01 |
0.641 |
0.594 |
0.116 |
UMass |
| wk02 |
0.356 |
0.429 |
0.041 |
California |
| wk03 |
0.536 |
0.595 |
0.127 |
Samford |
| wk04 |
0.214 |
0.312 |
0.062 |
Texas A&M |
| wk05 |
0.389 |
0.391 |
0.078 |
Georgia |
| wk07 |
0.265 |
0.361 |
0.082 |
LSU |
| wk08 |
0.249 |
0.304 |
0.054 |
Ole Miss |
| wk09 |
0.387 |
0.484 |
0.113 |
Mississippi State |
| wk10 |
0.306 |
0.302 |
0.127 |
Vanderbilt |
| wk11 |
0.628 |
0.623 |
0.101 |
Arkansas |
| wk12 |
0.205 |
0.344 |
0.062 |
New Mexico State |
SR/XR: 2023, week 13, season regular: Alabama vs Auburn
| Alabama |
0.484 |
0.141 |
| Auburn |
0.397 |
0.121 |


Success by down: Auburn, 2023, week 13, season regular, Opponent: Alabama
| 1 |
10 |
16 |
26 |
5 |
| 2 |
9 |
12 |
21 |
8 |
| 3 |
4 |
7 |
11 |
4 |
| 4 |
0 |
0 |
0 |
0 |
3rd down Successful/Unsuccessful: Auburn, 2023, week 13, season regular, Opponent: Alabama
| 1 |
39 |
Successful |
| 3 |
68 |
Successful |
| 4 |
30 |
Unsuccessful |
| 4 |
73 |
Unsuccessful |
| 5 |
5 |
Unsuccessful |
| 5 |
53 |
Successful |
| 5 |
91 |
Unsuccessful |
| 8 |
73 |
Successful |
| 9 |
64 |
Unsuccessful |
| 10 |
51 |
Unsuccessful |
| 21 |
48 |
Unsuccessful |
Distance to 1st/TD, Yards gained statistics by down: Auburn, 2023, week 13, season regular, Opponent: Alabama
| 1 |
26 |
0 |
9.69231 |
1.22537 |
10.0 |
5.03846 |
9.81623 |
4.0 |
| 2 |
21 |
5 |
7.85714 |
5.39709 |
6.0 |
8.14286 |
13.8827 |
2.0 |
| 3 |
11 |
10 |
6.81818 |
5.40034 |
5.0 |
5.09091 |
11.8191 |
2.0 |
| 4 |
0 |
11 |
NaN |
NaN |
NaN |
NaN |
NaN |
NaN |


Penalties: 2023, week 13, season regular
| Alabama |
Personal Foul |
enforced |
| Alabama |
Holding |
enforced |
| Alabama |
Illegal Forward Pass |
enforced |
| Alabama |
Face Mask |
enforced |
| Alabama |
Delay Of Game |
enforced |
| Alabama |
Personal Foul |
enforced |
| Alabama |
Offsides |
enforced |
| Alabama |
Illegal Forward Pass |
enforced |
| Auburn |
False Start |
enforced |
| Auburn |
Illegal Forward Pass |
enforced |
| Auburn |
Block In The Back |
enforced |
| Auburn |
Offsides |
enforced |
| Auburn |
Block In The Back |
enforced |
All SEC teams
All data below includes intra-conference games and OOC games.
Summary statistics for FBS conferences
| FBS |
5.86 |
2.75 |
0 |
4.0 |
6.0 |
8.0 |
18 |
| ACC |
6.12 |
3.03 |
0 |
4.0 |
6.0 |
8.0 |
18 |
| American Athletic |
5.34 |
2.71 |
0 |
3.0 |
5.0 |
7.0 |
14 |
| Big 12 |
5.40 |
2.27 |
1 |
4.0 |
5.0 |
7.0 |
11 |
| Big Ten |
5.04 |
2.66 |
0 |
3.0 |
5.0 |
6.0 |
14 |
| Conference USA |
5.96 |
2.38 |
1 |
4.0 |
6.0 |
7.0 |
13 |
| FBS Independents |
5.87 |
2.94 |
0 |
4.0 |
6.0 |
8.0 |
12 |
| Mid-American |
5.87 |
2.62 |
0 |
4.0 |
6.0 |
8.0 |
12 |
| Mountain West |
5.85 |
3.50 |
0 |
3.0 |
5.0 |
8.0 |
17 |
| Pac-12 |
6.62 |
2.84 |
2 |
5.0 |
6.0 |
8.0 |
17 |
| SEC |
6.34 |
2.87 |
0 |
4.5 |
6.0 |
8.0 |
14 |
| Sun Belt |
5.89 |
2.49 |
1 |
4.0 |
6.0 |
8.0 |
14 |
ACC
| 0 |
missing |
missing |
missing |
missing |
missing |
missing |
missing |
missing |
missing |
missing |
missing |
missing |
missing |
missing |
| 1 |
10 |
1 |
7 |
7 |
2 |
7 |
8 |
1 |
7 |
7 |
7 |
2 |
4 |
4 |
| 2 |
10 |
4 |
4 |
3 |
3 |
7 |
10 |
8 |
5 |
5 |
9 |
8 |
3 |
3 |
| 3 |
18 |
5 |
1 |
5 |
0 |
6 |
5 |
6 |
5 |
9 |
9 |
7 |
7 |
6 |
| 4 |
7 |
6 |
8 |
7 |
14 |
4 |
7 |
7 |
3 |
11 |
6 |
7 |
9 |
2 |
| 5 |
5 |
6 |
2 |
missing |
6 |
10 |
missing |
10 |
missing |
9 |
9 |
11 |
10 |
missing |
| 6 |
3 |
6 |
missing |
12 |
11 |
6 |
6 |
6 |
5 |
missing |
7 |
5 |
6 |
3 |
| 7 |
missing |
missing |
6 |
6 |
missing |
5 |
7 |
11 |
14 |
8 |
2 |
missing |
8 |
5 |
| 8 |
5 |
7 |
7 |
8 |
5 |
missing |
8 |
missing |
6 |
13 |
missing |
6 |
missing |
4 |
| 9 |
4 |
4 |
10 |
9 |
3 |
4 |
2 |
2 |
8 |
5 |
7 |
0 |
5 |
5 |
| 10 |
2 |
0 |
5 |
6 |
8 |
6 |
6 |
5 |
10 |
11 |
9 |
4 |
6 |
5 |
| 11 |
4 |
6 |
8 |
3 |
4 |
7 |
7 |
2 |
3 |
3 |
5 |
13 |
5 |
4 |
| 12 |
8 |
7 |
1 |
8 |
3 |
4 |
5 |
6 |
10 |
4 |
12 |
12 |
4 |
4 |
| 13 |
3 |
5 |
8 |
5 |
3 |
3 |
3 |
8 |
9 |
9 |
6 |
3 |
9 |
4 |
| Pittsburgh |
94 |
7.83 |
0.56 |
| Syracuse |
88 |
7.33 |
0.40 |
| North Carolina |
85 |
7.08 |
0.32 |
| Boston College |
79 |
6.58 |
0.15 |
| Florida State |
79 |
6.58 |
0.15 |
| Virginia |
78 |
6.50 |
0.12 |
| Virginia Tech |
76 |
6.33 |
0.07 |
| Miami |
74 |
6.17 |
0.01 |
| NC State |
72 |
6.00 |
-0.04 |
| Louisville |
69 |
5.75 |
-0.12 |
| Duke |
67 |
5.58 |
-0.18 |
| Georgia Tech |
62 |
5.17 |
-0.32 |
| Clemson |
57 |
4.75 |
-0.45 |
| Wake Forest |
49 |
4.08 |
-0.67 |
American Athletic
| 0 |
missing |
missing |
missing |
missing |
missing |
missing |
missing |
missing |
missing |
missing |
missing |
missing |
missing |
missing |
| 1 |
6 |
10 |
3 |
5 |
3 |
2 |
5 |
6 |
11 |
3 |
7 |
4 |
5 |
8 |
| 2 |
6 |
11 |
5 |
3 |
4 |
3 |
4 |
2 |
14 |
7 |
2 |
7 |
4 |
1 |
| 3 |
7 |
11 |
6 |
3 |
2 |
9 |
6 |
7 |
5 |
9 |
4 |
7 |
9 |
5 |
| 4 |
7 |
5 |
6 |
5 |
missing |
missing |
6 |
4 |
9 |
6 |
9 |
3 |
4 |
5 |
| 5 |
7 |
6 |
missing |
5 |
8 |
6 |
10 |
8 |
1 |
3 |
5 |
2 |
3 |
missing |
| 6 |
missing |
missing |
1 |
missing |
7 |
0 |
6 |
missing |
9 |
2 |
missing |
5 |
11 |
8 |
| 7 |
5 |
7 |
4 |
5 |
6 |
3 |
missing |
2 |
5 |
3 |
7 |
missing |
11 |
6 |
| 8 |
9 |
1 |
3 |
5 |
4 |
2 |
2 |
4 |
7 |
5 |
4 |
3 |
1 |
8 |
| 9 |
12 |
5 |
5 |
4 |
missing |
7 |
4 |
3 |
missing |
missing |
5 |
3 |
missing |
6 |
| 10 |
4 |
2 |
2 |
7 |
7 |
4 |
10 |
7 |
7 |
0 |
7 |
10 |
8 |
4 |
| 11 |
9 |
2 |
1 |
4 |
8 |
9 |
5 |
3 |
10 |
7 |
1 |
4 |
5 |
5 |
| 12 |
4 |
4 |
2 |
6 |
7 |
5 |
6 |
3 |
6 |
3 |
2 |
4 |
9 |
7 |
| 13 |
7 |
6 |
3 |
1 |
7 |
6 |
3 |
3 |
4 |
6 |
5 |
9 |
7 |
5 |
| South Florida |
88 |
7.33 |
0.74 |
| Charlotte |
83 |
6.92 |
0.58 |
| UAB |
77 |
6.42 |
0.40 |
| East Carolina |
70 |
5.83 |
0.18 |
| Navy |
63 |
5.73 |
0.14 |
| UT San Antonio |
68 |
5.67 |
0.12 |
| Rice |
67 |
5.58 |
0.09 |
| Tulsa |
61 |
5.08 |
-0.09 |
| Tulane |
58 |
4.83 |
-0.19 |
| North Texas |
56 |
4.67 |
-0.25 |
| Temple |
54 |
4.50 |
-0.31 |
| Memphis |
53 |
4.42 |
-0.34 |
| SMU |
52 |
4.33 |
-0.37 |
| Florida Atlantic |
41 |
3.42 |
-0.71 |
Big 12
| 0 |
missing |
missing |
missing |
missing |
missing |
missing |
missing |
missing |
missing |
missing |
missing |
missing |
missing |
missing |
| 1 |
9 |
8 |
7 |
3 |
9 |
3 |
4 |
6 |
5 |
10 |
5 |
7 |
7 |
5 |
| 2 |
5 |
3 |
7 |
6 |
2 |
4 |
5 |
9 |
9 |
5 |
4 |
6 |
4 |
4 |
| 3 |
2 |
7 |
10 |
7 |
5 |
7 |
7 |
7 |
7 |
7 |
6 |
2 |
7 |
4 |
| 4 |
4 |
3 |
2 |
11 |
5 |
7 |
5 |
8 |
3 |
6 |
2 |
9 |
10 |
3 |
| 5 |
4 |
4 |
7 |
4 |
6 |
3 |
missing |
5 |
missing |
7 |
4 |
1 |
7 |
2 |
| 6 |
1 |
missing |
missing |
missing |
1 |
2 |
4 |
4 |
5 |
6 |
9 |
4 |
5 |
missing |
| 7 |
missing |
5 |
6 |
7 |
5 |
3 |
5 |
missing |
3 |
7 |
missing |
5 |
missing |
8 |
| 8 |
5 |
4 |
4 |
1 |
missing |
missing |
6 |
6 |
7 |
4 |
6 |
9 |
7 |
5 |
| 9 |
2 |
3 |
4 |
6 |
4 |
5 |
1 |
11 |
4 |
missing |
6 |
missing |
6 |
4 |
| 10 |
7 |
10 |
8 |
6 |
7 |
8 |
7 |
8 |
4 |
5 |
10 |
8 |
3 |
10 |
| 11 |
4 |
4 |
2 |
3 |
6 |
4 |
5 |
5 |
5 |
6 |
7 |
4 |
4 |
2 |
| 12 |
1 |
7 |
5 |
10 |
4 |
5 |
2 |
6 |
5 |
4 |
7 |
7 |
8 |
5 |
| 13 |
5 |
6 |
6 |
4 |
6 |
4 |
6 |
5 |
5 |
7 |
9 |
5 |
4 |
5 |
| Oklahoma |
80 |
6.67 |
0.56 |
| Texas |
75 |
6.25 |
0.37 |
| TCU |
74 |
6.17 |
0.34 |
| UCF |
72 |
6.00 |
0.26 |
| Cincinnati |
68 |
5.67 |
0.12 |
| Houston |
68 |
5.67 |
0.12 |
| Texas Tech |
67 |
5.58 |
0.08 |
| BYU |
64 |
5.33 |
-0.03 |
| Oklahoma State |
62 |
5.17 |
-0.11 |
| Iowa State |
60 |
5.00 |
-0.18 |
| Kansas State |
57 |
4.75 |
-0.29 |
| West Virginia |
57 |
4.75 |
-0.29 |
| Kansas |
55 |
4.58 |
-0.36 |
| Baylor |
49 |
4.08 |
-0.58 |
Big Ten
| 0 |
missing |
missing |
missing |
missing |
missing |
missing |
missing |
missing |
missing |
missing |
missing |
missing |
missing |
missing |
| 1 |
10 |
8 |
7 |
6 |
5 |
8 |
3 |
7 |
3 |
5 |
1 |
4 |
2 |
3 |
| 2 |
6 |
7 |
0 |
4 |
4 |
5 |
2 |
6 |
4 |
6 |
7 |
7 |
5 |
4 |
| 3 |
6 |
4 |
1 |
7 |
1 |
11 |
3 |
5 |
1 |
5 |
7 |
11 |
4 |
8 |
| 4 |
6 |
5 |
4 |
4 |
3 |
6 |
5 |
6 |
8 |
5 |
4 |
7 |
5 |
11 |
| 5 |
9 |
4 |
3 |
4 |
0 |
10 |
1 |
4 |
4 |
missing |
6 |
3 |
4 |
missing |
| 6 |
3 |
missing |
2 |
4 |
1 |
missing |
4 |
10 |
8 |
10 |
missing |
6 |
4 |
2 |
| 7 |
5 |
5 |
5 |
5 |
2 |
5 |
missing |
missing |
missing |
9 |
6 |
5 |
6 |
7 |
| 8 |
9 |
5 |
6 |
missing |
7 |
11 |
7 |
3 |
8 |
6 |
5 |
missing |
6 |
6 |
| 9 |
missing |
5 |
missing |
6 |
missing |
4 |
3 |
6 |
8 |
6 |
6 |
9 |
missing |
5 |
| 10 |
4 |
2 |
3 |
4 |
1 |
7 |
2 |
0 |
7 |
5 |
7 |
5 |
3 |
8 |
| 11 |
14 |
7 |
0 |
10 |
6 |
5 |
2 |
1 |
5 |
3 |
5 |
6 |
7 |
5 |
| 12 |
6 |
6 |
6 |
5 |
2 |
3 |
1 |
7 |
4 |
5 |
1 |
5 |
6 |
4 |
| 13 |
1 |
7 |
2 |
5 |
3 |
6 |
3 |
5 |
5 |
1 |
4 |
3 |
8 |
3 |
| Michigan State |
81 |
6.75 |
0.65 |
| Illinois |
79 |
6.58 |
0.58 |
| Purdue |
71 |
5.92 |
0.33 |
| Ohio State |
66 |
5.50 |
0.17 |
| Wisconsin |
66 |
5.50 |
0.17 |
| Indiana |
65 |
5.42 |
0.14 |
| Northwestern |
65 |
5.42 |
0.14 |
| Maryland |
64 |
5.33 |
0.11 |
| Nebraska |
60 |
5.00 |
-0.01 |
| Rutgers |
60 |
5.00 |
-0.01 |
| Penn State |
59 |
4.92 |
-0.04 |
| Iowa |
39 |
3.25 |
-0.67 |
| Minnesota |
36 |
3.00 |
-0.77 |
| Michigan |
35 |
2.92 |
-0.80 |
Conference USA
| 0 |
5 |
7 |
missing |
5 |
missing |
6 |
missing |
10 |
missing |
| 1 |
missing |
missing |
4 |
missing |
9 |
missing |
7 |
missing |
9 |
| 2 |
6 |
7 |
7 |
8 |
6 |
6 |
2 |
6 |
4 |
| 3 |
8 |
missing |
10 |
5 |
12 |
7 |
missing |
6 |
3 |
| 4 |
5 |
4 |
4 |
12 |
6 |
3 |
10 |
8 |
3 |
| 5 |
missing |
6 |
missing |
13 |
7 |
missing |
8 |
9 |
8 |
| 6 |
5 |
4 |
8 |
7 |
6 |
4 |
3 |
missing |
4 |
| 7 |
5 |
7 |
7 |
7 |
7 |
8 |
3 |
4 |
missing |
| 8 |
5 |
2 |
8 |
missing |
5 |
7 |
8 |
8 |
1 |
| 9 |
9 |
1 |
4 |
5 |
missing |
5 |
3 |
7 |
7 |
| 10 |
missing |
7 |
10 |
7 |
7 |
8 |
2 |
6 |
4 |
| 11 |
6 |
missing |
4 |
5 |
4 |
7 |
5 |
missing |
2 |
| 12 |
5 |
3 |
3 |
2 |
5 |
9 |
5 |
7 |
5 |
| 13 |
3 |
9 |
8 |
missing |
7 |
6 |
5 |
5 |
4 |
| Louisiana Tech |
76 |
6.91 |
0.40 |
| UTEP |
76 |
6.91 |
0.40 |
| Middle Tennessee |
81 |
6.75 |
0.33 |
| Liberty |
77 |
6.42 |
0.19 |
| New Mexico State |
76 |
6.33 |
0.16 |
| Florida International |
62 |
5.64 |
-0.14 |
| Jacksonville State |
57 |
5.18 |
-0.33 |
| Sam Houston State |
61 |
5.08 |
-0.37 |
| Western Kentucky |
54 |
4.50 |
-0.61 |
FBS Independents
| 0 |
missing |
missing |
4 |
8 |
| 1 |
3 |
6 |
1 |
9 |
| 2 |
4 |
8 |
10 |
7 |
| 3 |
0 |
6 |
8 |
7 |
| 4 |
1 |
4 |
4 |
11 |
| 5 |
missing |
9 |
12 |
12 |
| 6 |
6 |
6 |
3 |
6 |
| 7 |
5 |
missing |
5 |
9 |
| 8 |
0 |
4 |
missing |
missing |
| 9 |
1 |
5 |
6 |
8 |
| 10 |
11 |
6 |
5 |
9 |
| 11 |
6 |
5 |
missing |
missing |
| 12 |
5 |
5 |
3 |
7 |
| 13 |
missing |
8 |
5 |
3 |
| UMass |
96 |
8.00 |
0.72 |
| Connecticut |
72 |
6.00 |
0.04 |
| Notre Dame |
66 |
5.50 |
-0.13 |
| Army |
42 |
3.82 |
-0.70 |
Mid-American
| 0 |
missing |
missing |
missing |
missing |
missing |
missing |
missing |
missing |
missing |
3 |
missing |
missing |
| 1 |
10 |
4 |
9 |
6 |
7 |
6 |
4 |
5 |
4 |
missing |
7 |
3 |
| 2 |
8 |
3 |
6 |
8 |
8 |
8 |
5 |
8 |
7 |
1 |
4 |
9 |
| 3 |
6 |
4 |
2 |
6 |
2 |
10 |
7 |
7 |
2 |
1 |
8 |
8 |
| 4 |
10 |
3 |
12 |
6 |
4 |
3 |
11 |
4 |
5 |
8 |
11 |
5 |
| 5 |
2 |
10 |
10 |
7 |
8 |
4 |
5 |
3 |
5 |
missing |
8 |
9 |
| 6 |
4 |
8 |
7 |
5 |
6 |
4 |
5 |
7 |
5 |
7 |
7 |
6 |
| 7 |
9 |
6 |
10 |
4 |
6 |
2 |
6 |
5 |
1 |
7 |
5 |
7 |
| 8 |
9 |
7 |
3 |
6 |
8 |
7 |
0 |
4 |
10 |
7 |
7 |
10 |
| 9 |
missing |
missing |
missing |
missing |
missing |
10 |
missing |
7 |
missing |
11 |
missing |
6 |
| 10 |
3 |
5 |
5 |
2 |
8 |
missing |
6 |
missing |
9 |
missing |
6 |
missing |
| 11 |
7 |
3 |
11 |
3 |
7 |
7 |
5 |
2 |
2 |
4 |
4 |
10 |
| 12 |
8 |
6 |
6 |
2 |
10 |
6 |
7 |
2 |
3 |
8 |
6 |
9 |
| 13 |
5 |
3 |
3 |
3 |
6 |
8 |
4 |
2 |
2 |
4 |
6 |
2 |
| Bowling Green |
84 |
7.00 |
0.43 |
| Western Michigan |
84 |
7.00 |
0.43 |
| Akron |
81 |
6.75 |
0.33 |
| Central Michigan |
80 |
6.67 |
0.30 |
| Toledo |
79 |
6.58 |
0.27 |
| Eastern Michigan |
75 |
6.25 |
0.14 |
| Ohio |
61 |
5.55 |
-0.13 |
| Kent State |
65 |
5.42 |
-0.17 |
| Ball State |
62 |
5.17 |
-0.27 |
| Buffalo |
58 |
4.83 |
-0.40 |
| Miami (OH) |
56 |
4.67 |
-0.46 |
| Northern Illinois |
55 |
4.58 |
-0.49 |
Mountain West
| 0 |
missing |
missing |
missing |
missing |
7 |
missing |
missing |
14 |
missing |
missing |
missing |
| 1 |
2 |
3 |
4 |
7 |
missing |
4 |
10 |
missing |
6 |
10 |
3 |
| 2 |
2 |
4 |
missing |
7 |
11 |
3 |
11 |
4 |
3 |
4 |
3 |
| 3 |
6 |
4 |
17 |
9 |
5 |
3 |
7 |
1 |
10 |
4 |
3 |
| 4 |
4 |
4 |
11 |
3 |
4 |
3 |
6 |
5 |
10 |
9 |
8 |
| 5 |
1 |
3 |
8 |
3 |
6 |
10 |
10 |
5 |
8 |
7 |
6 |
| 6 |
missing |
3 |
8 |
8 |
missing |
missing |
missing |
missing |
missing |
7 |
2 |
| 7 |
1 |
9 |
10 |
5 |
2 |
6 |
15 |
1 |
7 |
8 |
3 |
| 8 |
5 |
missing |
4 |
missing |
2 |
10 |
10 |
7 |
6 |
7 |
missing |
| 9 |
2 |
3 |
5 |
4 |
5 |
12 |
7 |
missing |
6 |
missing |
5 |
| 10 |
6 |
4 |
3 |
1 |
10 |
5 |
7 |
9 |
6 |
6 |
10 |
| 11 |
3 |
4 |
11 |
1 |
5 |
12 |
9 |
4 |
4 |
13 |
2 |
| 12 |
4 |
3 |
5 |
1 |
3 |
7 |
11 |
1 |
10 |
5 |
0 |
| 13 |
3 |
1 |
5 |
1 |
9 |
6 |
15 |
2 |
4 |
13 |
3 |
| New Mexico |
118 |
9.83 |
1.14 |
| Utah State |
93 |
7.75 |
0.54 |
| Colorado State |
91 |
7.58 |
0.49 |
| Nevada |
81 |
6.75 |
0.26 |
| UNLV |
80 |
6.67 |
0.23 |
| Hawai'i |
69 |
5.75 |
-0.03 |
| San Diego State |
53 |
4.82 |
-0.30 |
| Fresno State |
50 |
4.17 |
-0.48 |
| Wyoming |
48 |
4.00 |
-0.53 |
| Boise State |
45 |
3.75 |
-0.60 |
| Air Force |
39 |
3.25 |
-0.75 |
Pac-12
| 0 |
missing |
missing |
missing |
missing |
missing |
missing |
missing |
missing |
8 |
missing |
missing |
missing |
| 1 |
11 |
9 |
8 |
6 |
2 |
9 |
9 |
8 |
8 |
5 |
5 |
3 |
| 2 |
5 |
4 |
4 |
9 |
14 |
2 |
5 |
7 |
8 |
7 |
7 |
8 |
| 3 |
6 |
2 |
6 |
10 |
9 |
4 |
6 |
3 |
missing |
5 |
11 |
5 |
| 4 |
5 |
4 |
2 |
12 |
9 |
5 |
6 |
6 |
10 |
4 |
9 |
7 |
| 5 |
8 |
5 |
7 |
7 |
2 |
11 |
4 |
missing |
6 |
3 |
12 |
missing |
| 6 |
12 |
9 |
3 |
8 |
missing |
5 |
missing |
8 |
8 |
missing |
missing |
4 |
| 7 |
5 |
missing |
7 |
17 |
5 |
11 |
7 |
9 |
9 |
3 |
5 |
5 |
| 8 |
missing |
7 |
missing |
missing |
7 |
missing |
10 |
5 |
6 |
8 |
5 |
8 |
| 9 |
4 |
9 |
5 |
7 |
8 |
2 |
8 |
9 |
11 |
3 |
7 |
5 |
| 10 |
3 |
6 |
3 |
8 |
9 |
4 |
5 |
5 |
6 |
6 |
6 |
5 |
| 11 |
8 |
7 |
11 |
11 |
13 |
5 |
4 |
9 |
6 |
8 |
11 |
7 |
| 12 |
5 |
4 |
4 |
5 |
5 |
8 |
9 |
6 |
6 |
7 |
10 |
6 |
| 13 |
6 |
3 |
5 |
7 |
6 |
4 |
2 |
5 |
missing |
2 |
7 |
10 |
| Colorado |
107 |
8.92 |
0.81 |
| Washington |
95 |
7.92 |
0.45 |
| USC |
92 |
7.67 |
0.37 |
| Oregon |
89 |
7.42 |
0.28 |
| UCLA |
80 |
6.67 |
0.01 |
| Arizona |
78 |
6.50 |
-0.04 |
| Stanford |
75 |
6.25 |
-0.13 |
| Washington State |
73 |
6.08 |
-0.19 |
| Oregon State |
70 |
5.83 |
-0.28 |
| Arizona State |
69 |
5.75 |
-0.31 |
| California |
65 |
5.42 |
-0.43 |
| Utah |
61 |
5.08 |
-0.54 |
SEC
| 0 |
missing |
missing |
missing |
missing |
missing |
missing |
missing |
missing |
missing |
missing |
missing |
missing |
missing |
8 |
| 1 |
2 |
7 |
4 |
9 |
5 |
7 |
2 |
1 |
7 |
7 |
6 |
4 |
9 |
missing |
| 2 |
10 |
4 |
7 |
4 |
3 |
10 |
2 |
9 |
5 |
5 |
8 |
10 |
7 |
5 |
| 3 |
5 |
14 |
5 |
5 |
6 |
5 |
6 |
4 |
6 |
5 |
11 |
10 |
8 |
2 |
| 4 |
6 |
11 |
10 |
5 |
5 |
10 |
5 |
5 |
7 |
8 |
4 |
5 |
7 |
7 |
| 5 |
6 |
0 |
1 |
10 |
3 |
3 |
6 |
3 |
9 |
11 |
4 |
7 |
6 |
4 |
| 6 |
14 |
10 |
missing |
8 |
6 |
5 |
11 |
6 |
11 |
5 |
missing |
missing |
4 |
5 |
| 7 |
5 |
2 |
5 |
6 |
4 |
14 |
12 |
missing |
6 |
missing |
9 |
12 |
11 |
5 |
| 8 |
1 |
5 |
7 |
missing |
missing |
missing |
3 |
8 |
6 |
10 |
6 |
8 |
missing |
missing |
| 9 |
missing |
missing |
7 |
2 |
2 |
4 |
missing |
8 |
missing |
6 |
8 |
9 |
2 |
4 |
| 10 |
6 |
6 |
5 |
7 |
5 |
6 |
8 |
9 |
8 |
8 |
10 |
11 |
9 |
4 |
| 11 |
6 |
4 |
2 |
6 |
5 |
4 |
8 |
12 |
7 |
9 |
6 |
9 |
5 |
2 |
| 12 |
3 |
6 |
9 |
9 |
2 |
7 |
5 |
6 |
7 |
8 |
9 |
3 |
3 |
missing |
| 13 |
8 |
7 |
5 |
8 |
6 |
0 |
6 |
4 |
7 |
6 |
4 |
10 |
4 |
10 |
| Tennessee |
98 |
8.17 |
0.64 |
| Ole Miss |
88 |
7.33 |
0.35 |
| Missouri |
86 |
7.17 |
0.29 |
| South Carolina |
85 |
7.08 |
0.26 |
| Florida |
79 |
6.58 |
0.09 |
| Arkansas |
76 |
6.33 |
-0.00 |
| Kentucky |
75 |
6.25 |
-0.03 |
| Mississippi State |
75 |
6.25 |
-0.03 |
| Texas A&M |
75 |
6.25 |
-0.03 |
| LSU |
74 |
6.17 |
-0.06 |
| Alabama |
72 |
6.00 |
-0.12 |
| Auburn |
67 |
5.58 |
-0.26 |
| Vanderbilt |
56 |
5.09 |
-0.43 |
| Georgia |
52 |
4.33 |
-0.70 |
Sun Belt
| 0 |
missing |
missing |
missing |
missing |
missing |
missing |
missing |
missing |
missing |
missing |
missing |
missing |
missing |
missing |
| 1 |
2 |
14 |
3 |
9 |
5 |
4 |
2 |
5 |
5 |
4 |
7 |
5 |
4 |
5 |
| 2 |
7 |
3 |
4 |
6 |
2 |
7 |
10 |
3 |
4 |
3 |
6 |
13 |
6 |
3 |
| 3 |
3 |
4 |
3 |
5 |
11 |
6 |
8 |
6 |
missing |
5 |
8 |
6 |
10 |
6 |
| 4 |
2 |
3 |
10 |
5 |
9 |
6 |
5 |
missing |
3 |
7 |
5 |
5 |
9 |
7 |
| 5 |
6 |
10 |
10 |
10 |
5 |
10 |
7 |
5 |
10 |
9 |
5 |
7 |
8 |
4 |
| 6 |
missing |
2 |
missing |
missing |
missing |
missing |
5 |
2 |
6 |
5 |
9 |
4 |
3 |
8 |
| 7 |
6 |
missing |
9 |
3 |
8 |
3 |
missing |
3 |
8 |
missing |
missing |
missing |
6 |
9 |
| 8 |
5 |
9 |
4 |
3 |
4 |
4 |
4 |
9 |
3 |
8 |
9 |
4 |
missing |
missing |
| 9 |
5 |
3 |
5 |
1 |
5 |
2 |
6 |
9 |
7 |
6 |
8 |
9 |
4 |
5 |
| 10 |
4 |
7 |
3 |
7 |
2 |
5 |
4 |
5 |
7 |
7 |
4 |
4 |
9 |
5 |
| 11 |
4 |
3 |
3 |
7 |
6 |
5 |
10 |
8 |
9 |
5 |
8 |
5 |
12 |
4 |
| 12 |
5 |
9 |
6 |
5 |
7 |
8 |
8 |
7 |
7 |
9 |
5 |
6 |
6 |
6 |
| 13 |
1 |
7 |
3 |
8 |
6 |
9 |
6 |
8 |
7 |
5 |
6 |
7 |
5 |
1 |
| Texas State |
82 |
6.83 |
0.38 |
| South Alabama |
80 |
6.67 |
0.31 |
| Marshall |
76 |
6.33 |
0.18 |
| Louisiana |
75 |
6.25 |
0.15 |
| Southern Mississippi |
75 |
6.25 |
0.15 |
| Arkansas State |
74 |
6.17 |
0.11 |
| Old Dominion |
73 |
6.08 |
0.08 |
| Georgia State |
70 |
5.83 |
-0.02 |
| Louisiana Monroe |
70 |
5.83 |
-0.02 |
| Georgia Southern |
69 |
5.75 |
-0.06 |
| James Madison |
69 |
5.75 |
-0.06 |
| Coastal Carolina |
63 |
5.25 |
-0.26 |
| Troy |
63 |
5.25 |
-0.26 |
| Appalachian State |
50 |
4.17 |
-0.69 |
All FBS sorted by z-scores
| 1 |
New Mexico |
118 |
9.83 |
1.44 |
| 2 |
Colorado |
107 |
8.92 |
1.11 |
| 3 |
Tennessee |
98 |
8.17 |
0.84 |
| 4 |
UMass |
96 |
8.00 |
0.78 |
| 5 |
Washington |
95 |
7.92 |
0.75 |
| 6 |
Pittsburgh |
94 |
7.83 |
0.72 |
| 7 |
Utah State |
93 |
7.75 |
0.69 |
| 8 |
USC |
92 |
7.67 |
0.66 |
| 9 |
Colorado State |
91 |
7.58 |
0.63 |
| 10 |
Oregon |
89 |
7.42 |
0.57 |
| 11 |
Ole Miss |
88 |
7.33 |
0.54 |
| 12 |
South Florida |
88 |
7.33 |
0.54 |
| 13 |
Syracuse |
88 |
7.33 |
0.54 |
| 14 |
Missouri |
86 |
7.17 |
0.48 |
| 15 |
North Carolina |
85 |
7.08 |
0.45 |
| 16 |
South Carolina |
85 |
7.08 |
0.45 |
| 17 |
Bowling Green |
84 |
7.00 |
0.42 |
| 18 |
Western Michigan |
84 |
7.00 |
0.42 |
| 19 |
Charlotte |
83 |
6.92 |
0.38 |
| 20 |
Louisiana Tech |
76 |
6.91 |
0.38 |
| 21 |
UTEP |
76 |
6.91 |
0.38 |
| 22 |
Texas State |
82 |
6.83 |
0.35 |
| 23 |
Akron |
81 |
6.75 |
0.32 |
| 24 |
Michigan State |
81 |
6.75 |
0.32 |
| 25 |
Middle Tennessee |
81 |
6.75 |
0.32 |
| 26 |
Nevada |
81 |
6.75 |
0.32 |
| 27 |
Central Michigan |
80 |
6.67 |
0.29 |
| 28 |
Oklahoma |
80 |
6.67 |
0.29 |
| 29 |
South Alabama |
80 |
6.67 |
0.29 |
| 30 |
UCLA |
80 |
6.67 |
0.29 |
| 31 |
UNLV |
80 |
6.67 |
0.29 |
| 32 |
Boston College |
79 |
6.58 |
0.26 |
| 33 |
Florida |
79 |
6.58 |
0.26 |
| 34 |
Florida State |
79 |
6.58 |
0.26 |
| 35 |
Illinois |
79 |
6.58 |
0.26 |
| 36 |
Toledo |
79 |
6.58 |
0.26 |
| 37 |
Arizona |
78 |
6.50 |
0.23 |
| 38 |
Virginia |
78 |
6.50 |
0.23 |
| 39 |
Liberty |
77 |
6.42 |
0.20 |
| 40 |
UAB |
77 |
6.42 |
0.20 |
| 41 |
Arkansas |
76 |
6.33 |
0.17 |
| 42 |
Marshall |
76 |
6.33 |
0.17 |
| 43 |
New Mexico State |
76 |
6.33 |
0.17 |
| 44 |
Virginia Tech |
76 |
6.33 |
0.17 |
| 45 |
Eastern Michigan |
75 |
6.25 |
0.14 |
| 46 |
Kentucky |
75 |
6.25 |
0.14 |
| 47 |
Louisiana |
75 |
6.25 |
0.14 |
| 48 |
Mississippi State |
75 |
6.25 |
0.14 |
| 49 |
Southern Mississippi |
75 |
6.25 |
0.14 |
| 50 |
Stanford |
75 |
6.25 |
0.14 |
| 51 |
Texas |
75 |
6.25 |
0.14 |
| 52 |
Texas A&M |
75 |
6.25 |
0.14 |
| 53 |
Arkansas State |
74 |
6.17 |
0.11 |
| 54 |
LSU |
74 |
6.17 |
0.11 |
| 55 |
Miami |
74 |
6.17 |
0.11 |
| 56 |
TCU |
74 |
6.17 |
0.11 |
| 57 |
Old Dominion |
73 |
6.08 |
0.08 |
| 58 |
Washington State |
73 |
6.08 |
0.08 |
| 59 |
Alabama |
72 |
6.00 |
0.05 |
| 60 |
Connecticut |
72 |
6.00 |
0.05 |
| 61 |
NC State |
72 |
6.00 |
0.05 |
| 62 |
UCF |
72 |
6.00 |
0.05 |
| 63 |
Purdue |
71 |
5.92 |
0.02 |
| 64 |
East Carolina |
70 |
5.83 |
-0.01 |
| 65 |
Georgia State |
70 |
5.83 |
-0.01 |
| 66 |
Louisiana Monroe |
70 |
5.83 |
-0.01 |
| 67 |
Oregon State |
70 |
5.83 |
-0.01 |
| 68 |
Arizona State |
69 |
5.75 |
-0.04 |
| 69 |
Georgia Southern |
69 |
5.75 |
-0.04 |
| 70 |
Hawai'i |
69 |
5.75 |
-0.04 |
| 71 |
James Madison |
69 |
5.75 |
-0.04 |
| 72 |
Louisville |
69 |
5.75 |
-0.04 |
| 73 |
Navy |
63 |
5.73 |
-0.05 |
| 74 |
Cincinnati |
68 |
5.67 |
-0.07 |
| 75 |
Houston |
68 |
5.67 |
-0.07 |
| 76 |
UT San Antonio |
68 |
5.67 |
-0.07 |
| 77 |
Florida International |
62 |
5.64 |
-0.08 |
| 78 |
Auburn |
67 |
5.58 |
-0.10 |
| 79 |
Duke |
67 |
5.58 |
-0.10 |
| 80 |
Rice |
67 |
5.58 |
-0.10 |
| 81 |
Texas Tech |
67 |
5.58 |
-0.10 |
| 82 |
Ohio |
61 |
5.55 |
-0.11 |
| 83 |
Notre Dame |
66 |
5.50 |
-0.13 |
| 84 |
Ohio State |
66 |
5.50 |
-0.13 |
| 85 |
Wisconsin |
66 |
5.50 |
-0.13 |
| 86 |
California |
65 |
5.42 |
-0.16 |
| 87 |
Indiana |
65 |
5.42 |
-0.16 |
| 88 |
Kent State |
65 |
5.42 |
-0.16 |
| 89 |
Northwestern |
65 |
5.42 |
-0.16 |
| 90 |
BYU |
64 |
5.33 |
-0.19 |
| 91 |
Maryland |
64 |
5.33 |
-0.19 |
| 92 |
Coastal Carolina |
63 |
5.25 |
-0.22 |
| 93 |
Troy |
63 |
5.25 |
-0.22 |
| 94 |
Jacksonville State |
57 |
5.18 |
-0.25 |
| 95 |
Ball State |
62 |
5.17 |
-0.25 |
| 96 |
Georgia Tech |
62 |
5.17 |
-0.25 |
| 97 |
Oklahoma State |
62 |
5.17 |
-0.25 |
| 98 |
Vanderbilt |
56 |
5.09 |
-0.28 |
| 99 |
Sam Houston State |
61 |
5.08 |
-0.28 |
| 100 |
Tulsa |
61 |
5.08 |
-0.28 |
| 101 |
Utah |
61 |
5.08 |
-0.28 |
| 102 |
Iowa State |
60 |
5.00 |
-0.31 |
| 103 |
Nebraska |
60 |
5.00 |
-0.31 |
| 104 |
Rutgers |
60 |
5.00 |
-0.31 |
| 105 |
Penn State |
59 |
4.92 |
-0.34 |
| 106 |
Buffalo |
58 |
4.83 |
-0.37 |
| 107 |
Tulane |
58 |
4.83 |
-0.37 |
| 108 |
San Diego State |
53 |
4.82 |
-0.38 |
| 109 |
Clemson |
57 |
4.75 |
-0.40 |
| 110 |
Kansas State |
57 |
4.75 |
-0.40 |
| 111 |
West Virginia |
57 |
4.75 |
-0.40 |
| 112 |
Miami (OH) |
56 |
4.67 |
-0.43 |
| 113 |
North Texas |
56 |
4.67 |
-0.43 |
| 114 |
Kansas |
55 |
4.58 |
-0.46 |
| 115 |
Northern Illinois |
55 |
4.58 |
-0.46 |
| 116 |
Temple |
54 |
4.50 |
-0.49 |
| 117 |
Western Kentucky |
54 |
4.50 |
-0.49 |
| 118 |
Memphis |
53 |
4.42 |
-0.52 |
| 119 |
Georgia |
52 |
4.33 |
-0.55 |
| 120 |
SMU |
52 |
4.33 |
-0.55 |
| 121 |
Appalachian State |
50 |
4.17 |
-0.61 |
| 122 |
Fresno State |
50 |
4.17 |
-0.61 |
| 123 |
Baylor |
49 |
4.08 |
-0.64 |
| 124 |
Wake Forest |
49 |
4.08 |
-0.64 |
| 125 |
Wyoming |
48 |
4.00 |
-0.68 |
| 126 |
Army |
42 |
3.82 |
-0.74 |
| 127 |
Boise State |
45 |
3.75 |
-0.77 |
| 128 |
Florida Atlantic |
41 |
3.42 |
-0.89 |
| 129 |
Air Force |
39 |
3.25 |
-0.95 |
| 130 |
Iowa |
39 |
3.25 |
-0.95 |
| 131 |
Minnesota |
36 |
3.00 |
-1.04 |
| 132 |
Michigan |
35 |
2.92 |
-1.07 |
Data: @CFB_Data or collegefootballdata.com
FanPosts are just that; posts created by the fans. They are in no way indicative of the opinions of SBN and the authors of Roll Bama Roll.
Loading comments...