If you would like to see and play with the interactive version of these graphs you can find them at
https://github.com/MCurve7/mcurve7_cfb/tree/main/RBR/2023
You just need to download the Alabama_(year)_regular_wk??_(opponent).html file and open it in a web browser.
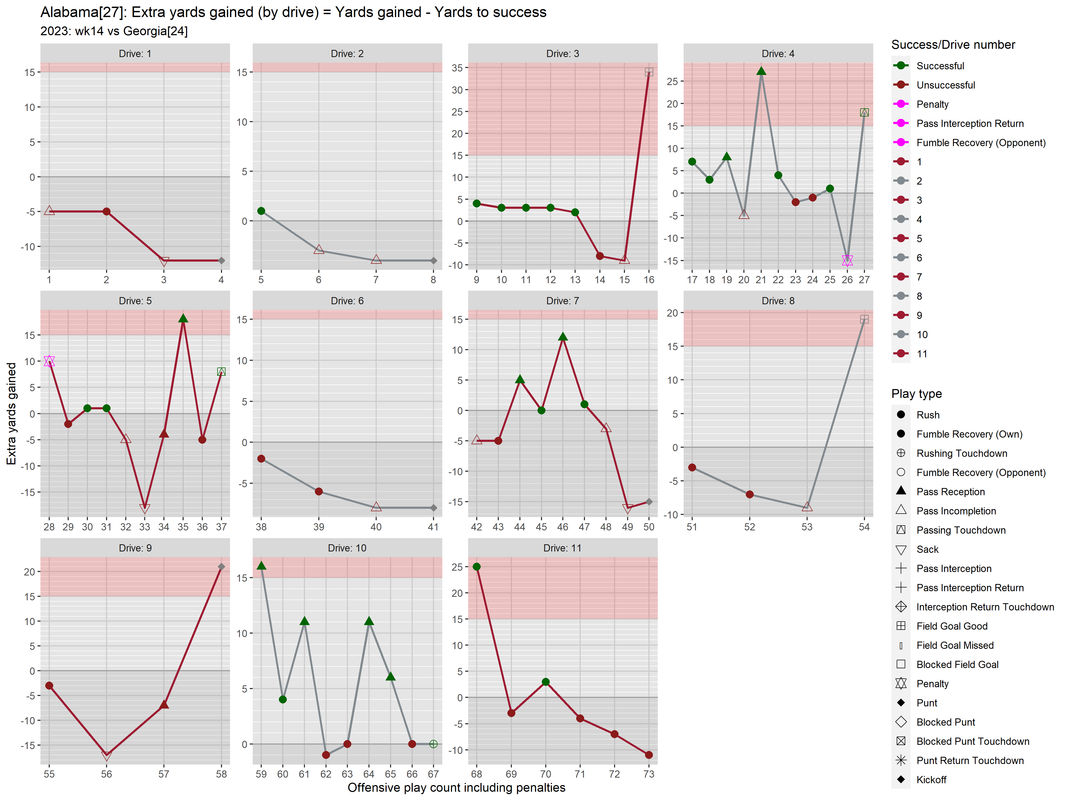
My eyes said that that wasn't our best offensive game of the year,
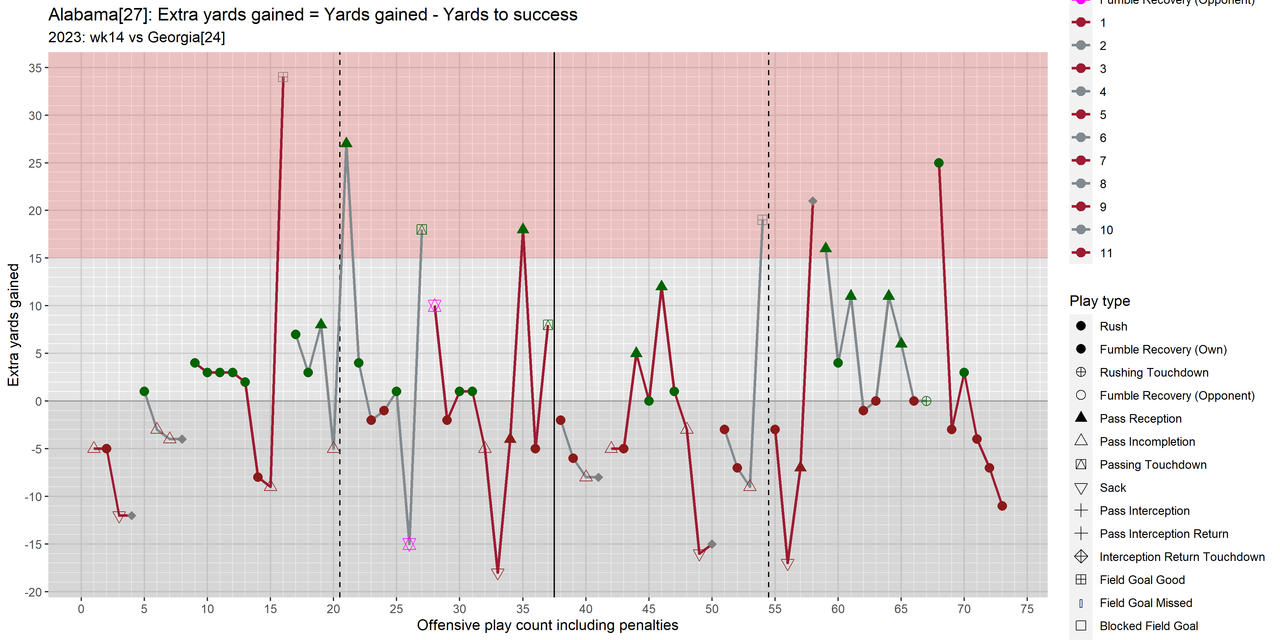
but as can be seen in the (new table this week) our game SR = 0.453 was infinitesimally better than our season average SR_μ = 0.452.
But our explosive rate dropped by 0.024 from a season average of XR_μ = 0.149 to XR = 0.125.
I'm not sure how significant that is yet and need more experience with these numbers.
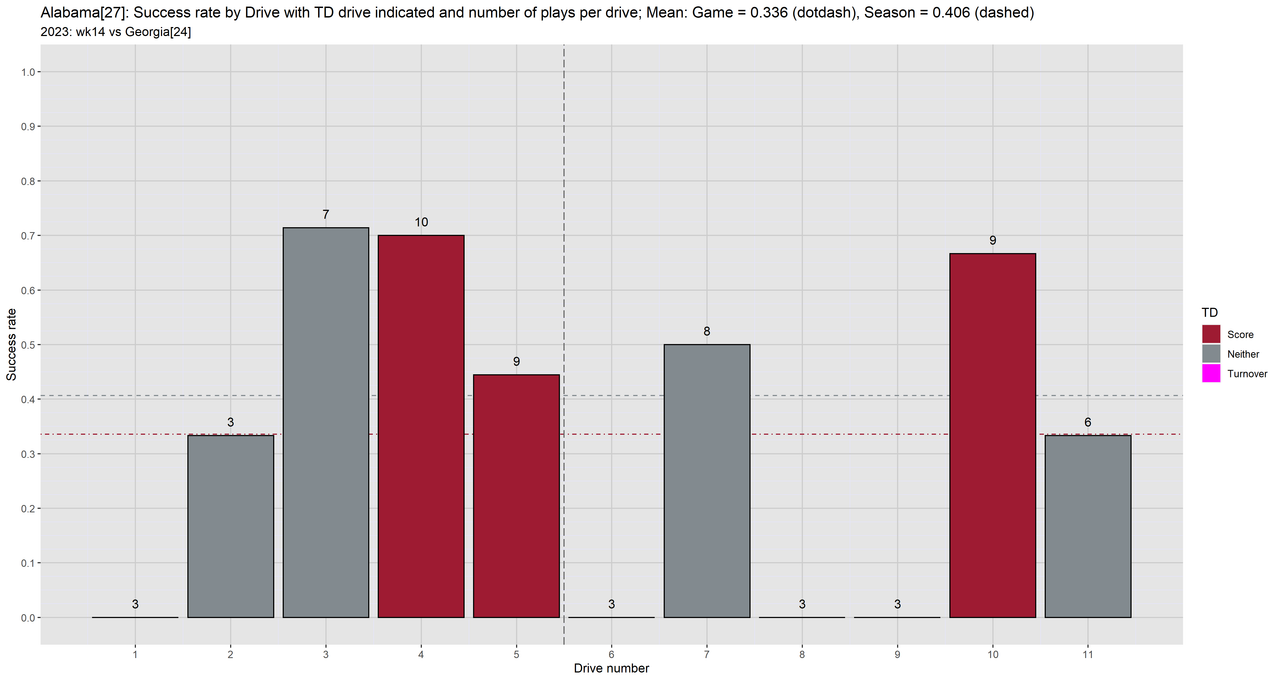
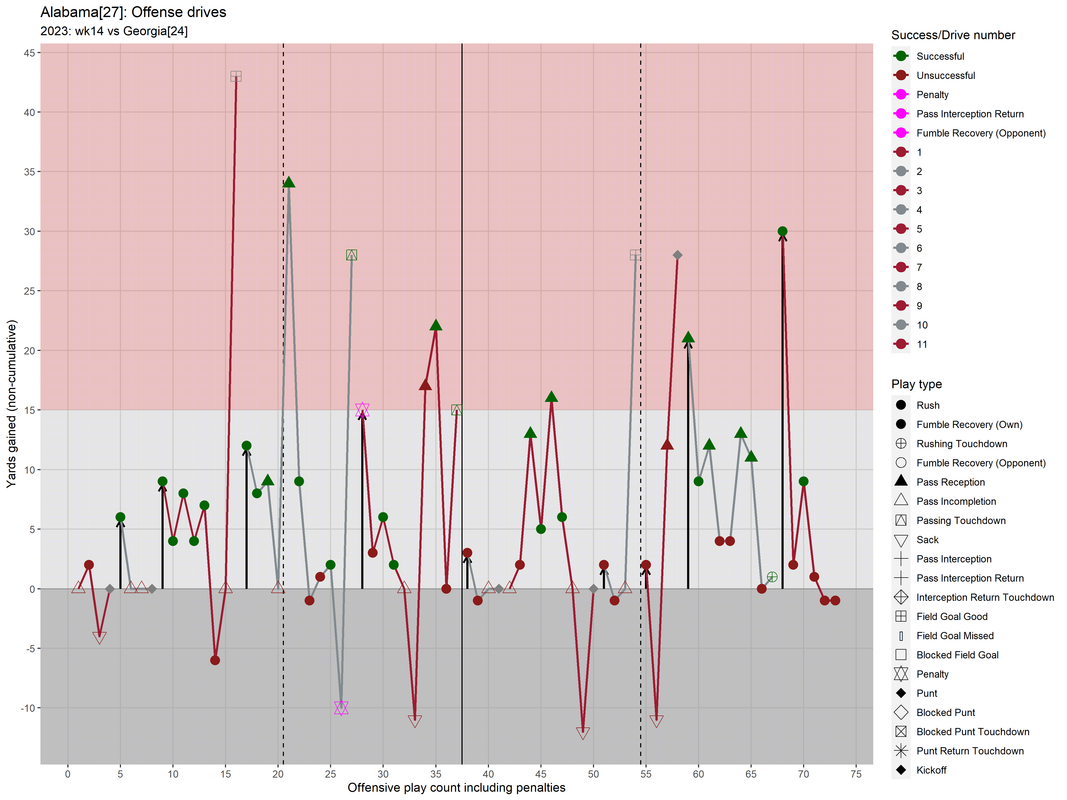
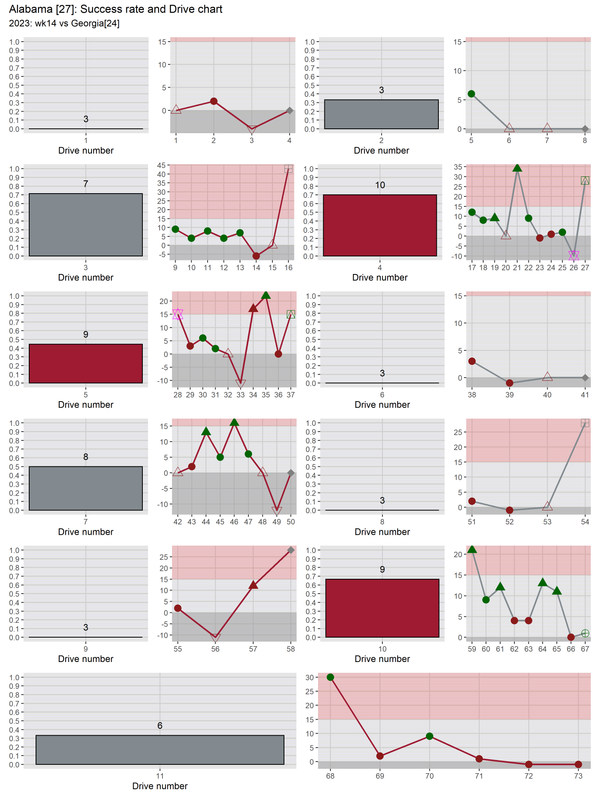
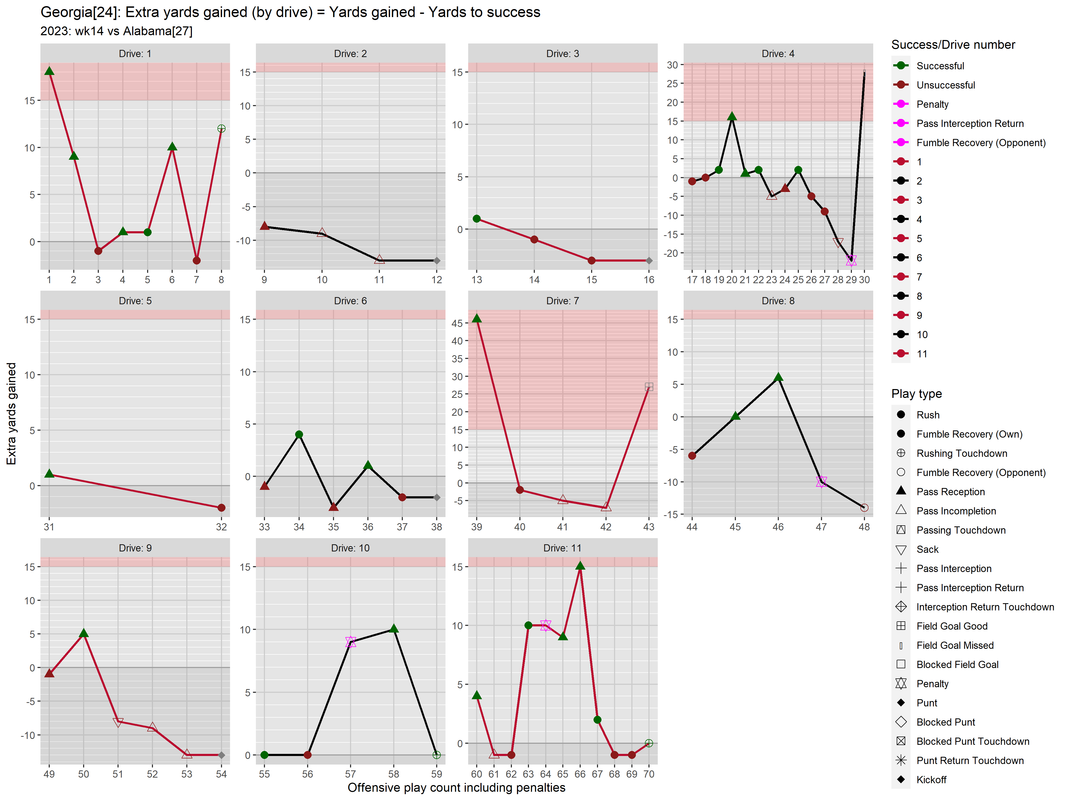
Our mean success rate by drive was 0.117 points below our success rate to give SR_drive = 0.336
and if I am interpreting these correctly then we were pretty inconsistent.
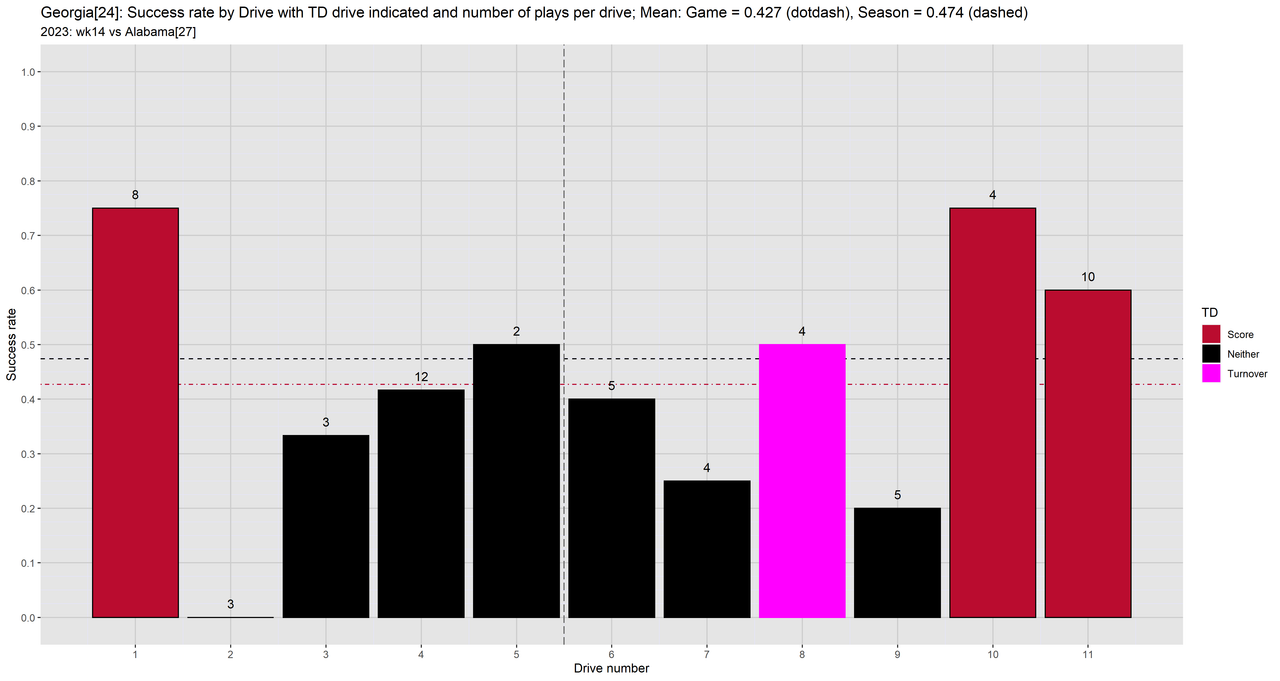
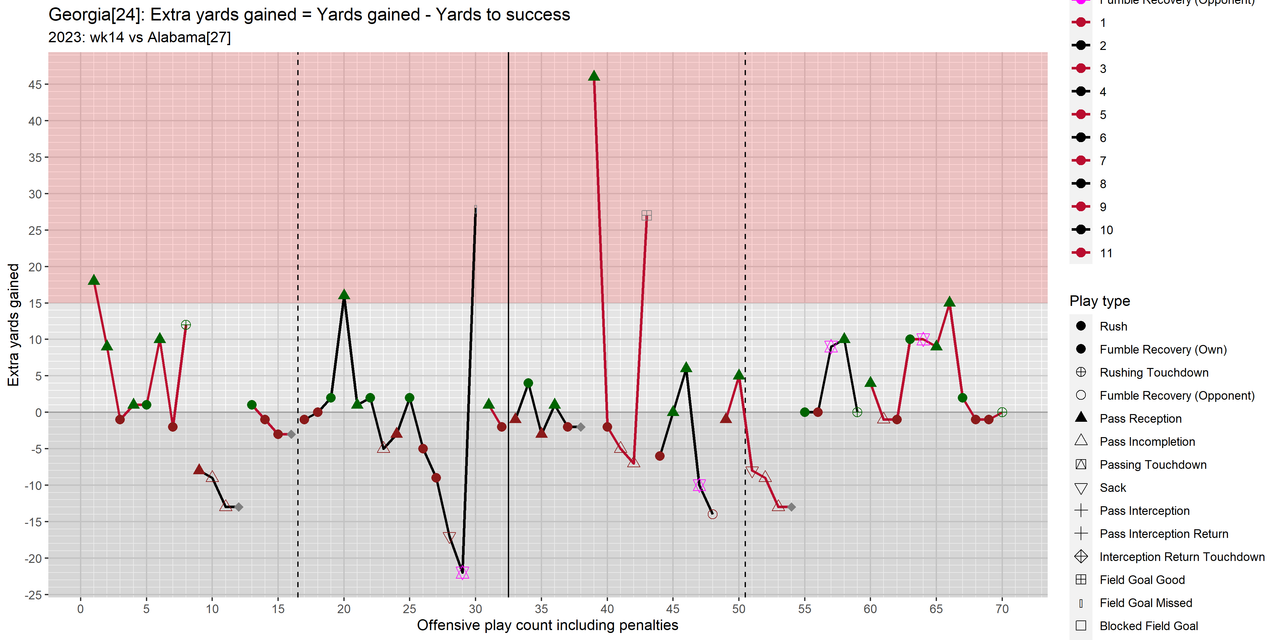
Georgia on the other hand looked more consistent
and I think the numbers back this up.
They had a game SR = 0.467 and a by drive mean SR_drive = 0.427 which gives a difference of -0.04.
But we were able to drop their season average SR_μ = 0.52 by -0.053 points
and their explosive rate was dropped 0.044 from XR_μ = 0.161 down to 0.117 in this game.
So I guess my take away from looking at the numbers is that while we were less consistent
our success rates were almost the same SR(Bama) = 0.453 vs SR(Dawg) = 0.467 with them slightly ahead of us.
But we edged them out slightly in explosivity XR(Bama) = 0.125 vs XR(Dawg) = 0.117
and had 64 offensive plays to their 56.
We were a bit less explosive but played about as well as we did for the season
but we were able to make Georgia less successful and explosive than they were for the season.
Success by drive: Alabama, 2023, week 14, season regular, Opponent: Georgia
| 1 |
3 |
0 |
3 |
0.0 |
Neither |
| 2 |
3 |
1 |
2 |
0.333333 |
Neither |
| 3 |
7 |
5 |
2 |
0.714286 |
Neither |
| 4 |
10 |
7 |
3 |
0.7 |
Score |
| 5 |
9 |
4 |
5 |
0.444444 |
Score |
| 6 |
3 |
0 |
3 |
0.0 |
Neither |
| 7 |
8 |
4 |
4 |
0.5 |
Neither |
| 8 |
3 |
0 |
3 |
0.0 |
Neither |
| 9 |
3 |
0 |
3 |
0.0 |
Neither |
| 10 |
9 |
6 |
3 |
0.666667 |
Score |
| 11 |
6 |
2 |
4 |
0.333333 |
Neither |
SR/XR, Mean SR/XR: 2023, season: regular after week 14, Alabama vs Georgia
| Alabama |
0.453 |
0.452 |
0.125 |
0.149 |
| Georgia |
0.467 |
0.52 |
0.117 |
0.161 |
Success by drive: Georgia, 2023, week 14, season regular, Opponent: Alabama
| 1 |
8 |
6 |
2 |
0.75 |
Score |
| 2 |
3 |
0 |
3 |
0.0 |
Neither |
| 3 |
3 |
1 |
2 |
0.333333 |
Neither |
| 4 |
12 |
5 |
7 |
0.416667 |
Neither |
| 5 |
2 |
1 |
1 |
0.5 |
Neither |
| 6 |
5 |
2 |
3 |
0.4 |
Neither |
| 7 |
4 |
1 |
3 |
0.25 |
Neither |
| 8 |
4 |
2 |
2 |
0.5 |
Turnover |
| 9 |
5 |
1 |
4 |
0.2 |
Neither |
| 10 |
4 |
3 |
1 |
0.75 |
Score |
| 11 |
10 |
6 |
4 |
0.6 |
Score |
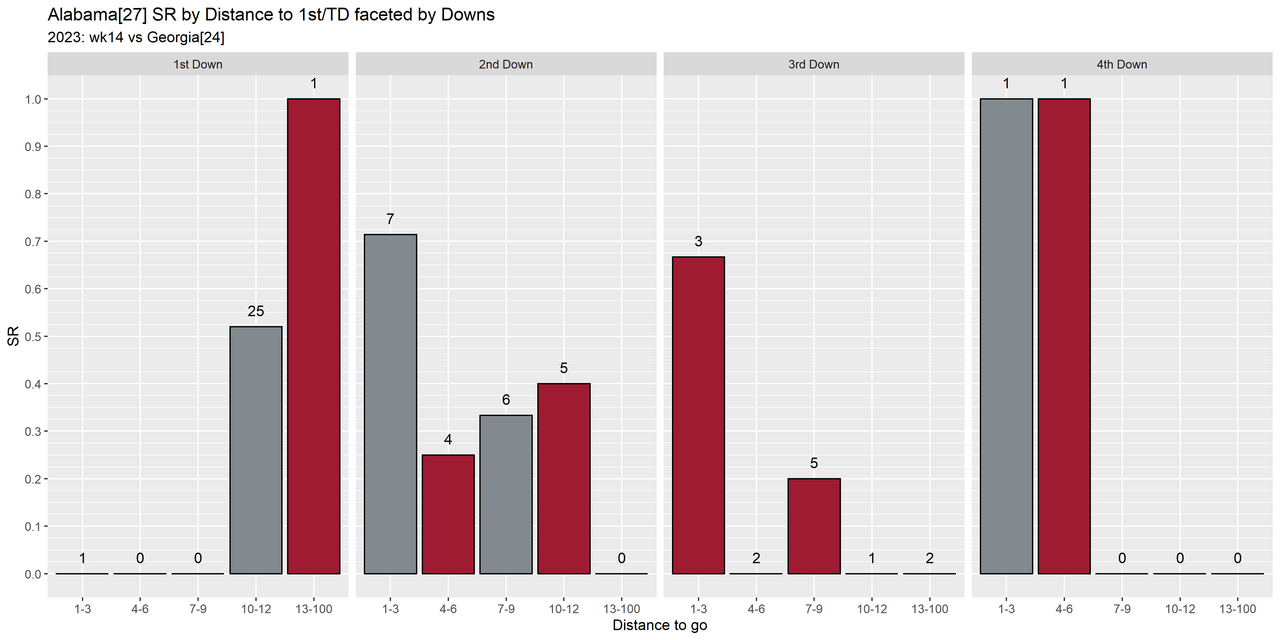
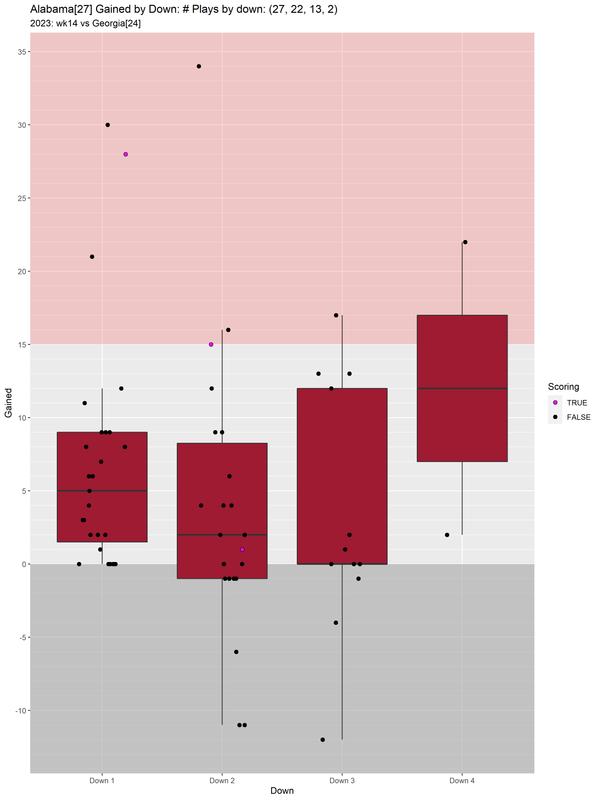
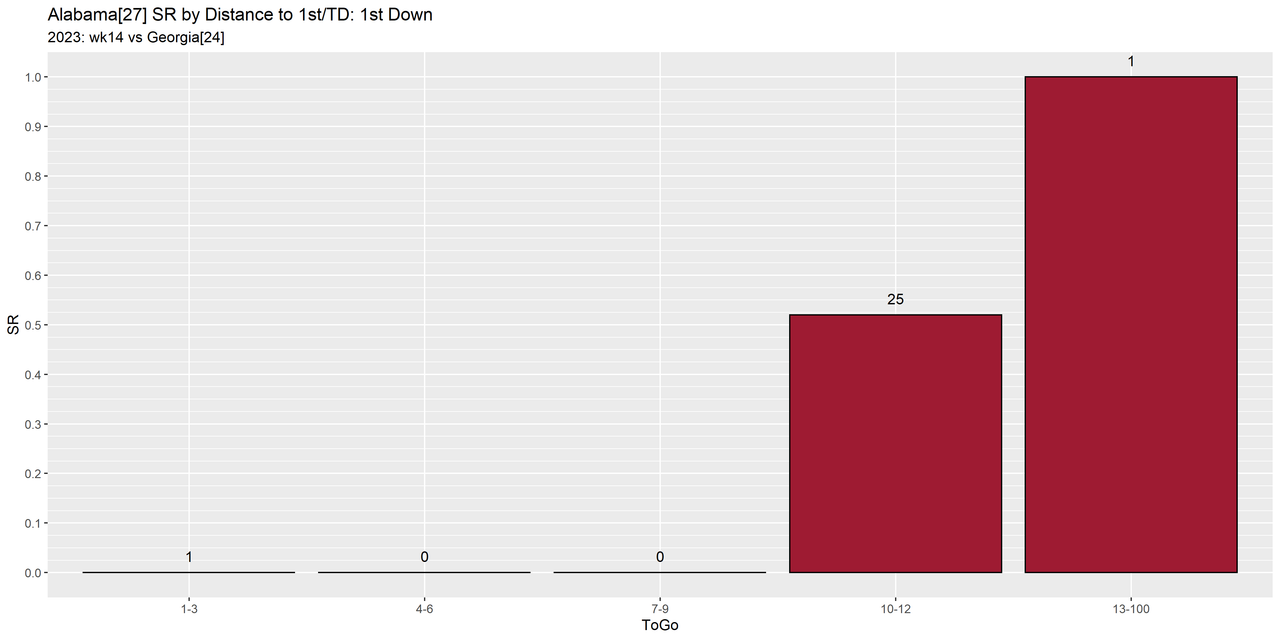
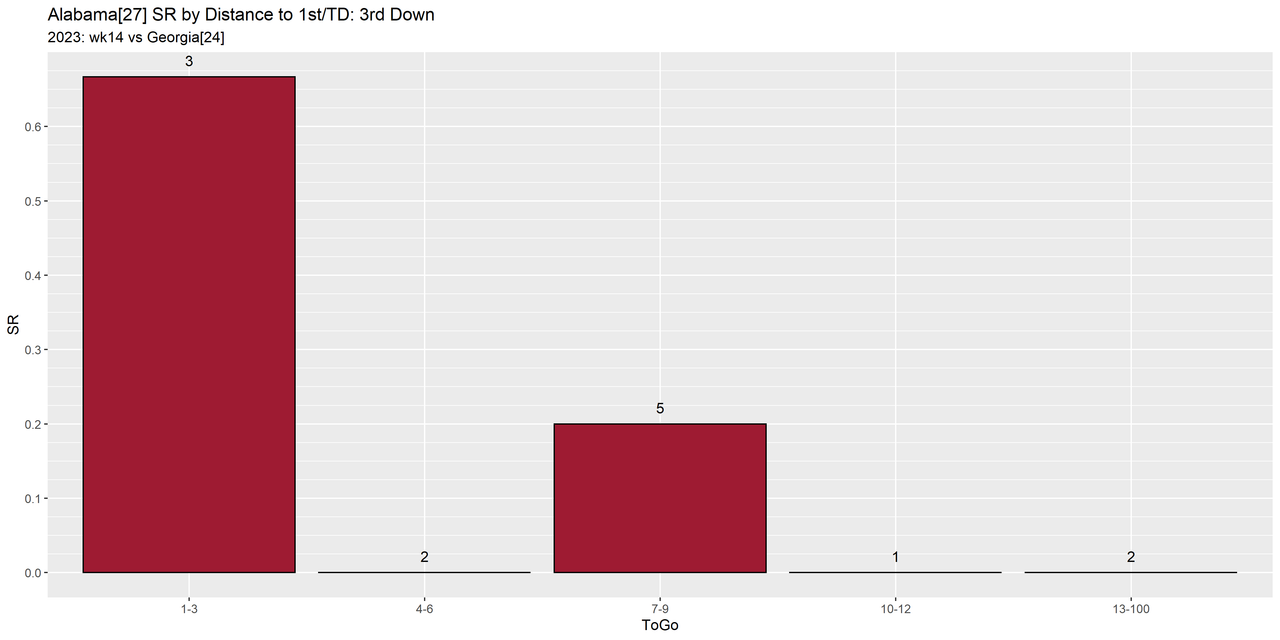
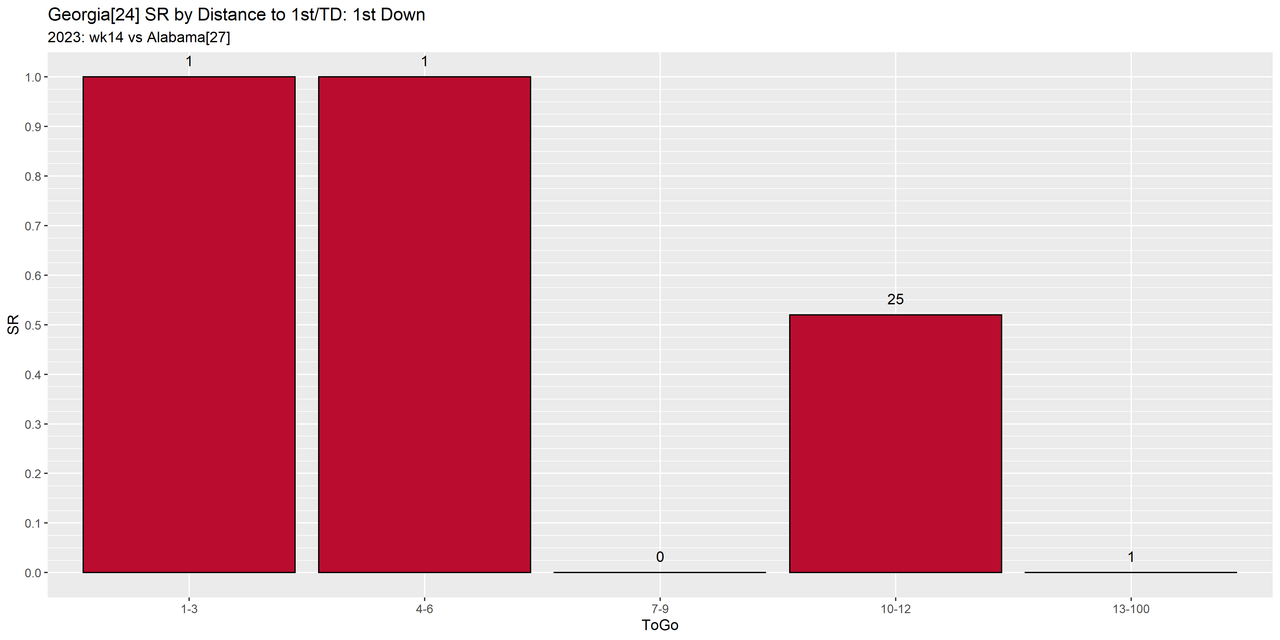
As balloons pointed out our 3rd down SR was bad unlike most of the season.
We had SR = 0.519 on 1st down,
but only 5 of those successful plays resulted in a 1st/TD, (1st/TD)/Successful = 0.357.
I'm not sure what I want to call the number of 1st/TD divided by the number of Successful plays by down (for 1st and 2nd down)
but for now let's call it ESR (extra success rate).
Our 2nd down SR was a little worse than on 1st SR = 0.455,
but we made a 1st/TD on 9 out of 10 of our successful plays, ESR = 0.9.
Then came 3rd down with a SR = 0.231 which I think would greatly contribute to our inconsistent play.
There is good news and bad news on our 4th down.
The good news is that on 4th down SR = 1.000,
but the bad news is that we needed to go for it twice on 4th.
Success by down: Alabama, 2023, week 14, season regular, Opponent: Georgia
| 1 |
14 |
13 |
27 |
5 |
| 2 |
10 |
12 |
22 |
9 |
| 3 |
3 |
10 |
13 |
3 |
| 4 |
2 |
0 |
2 |
2 |
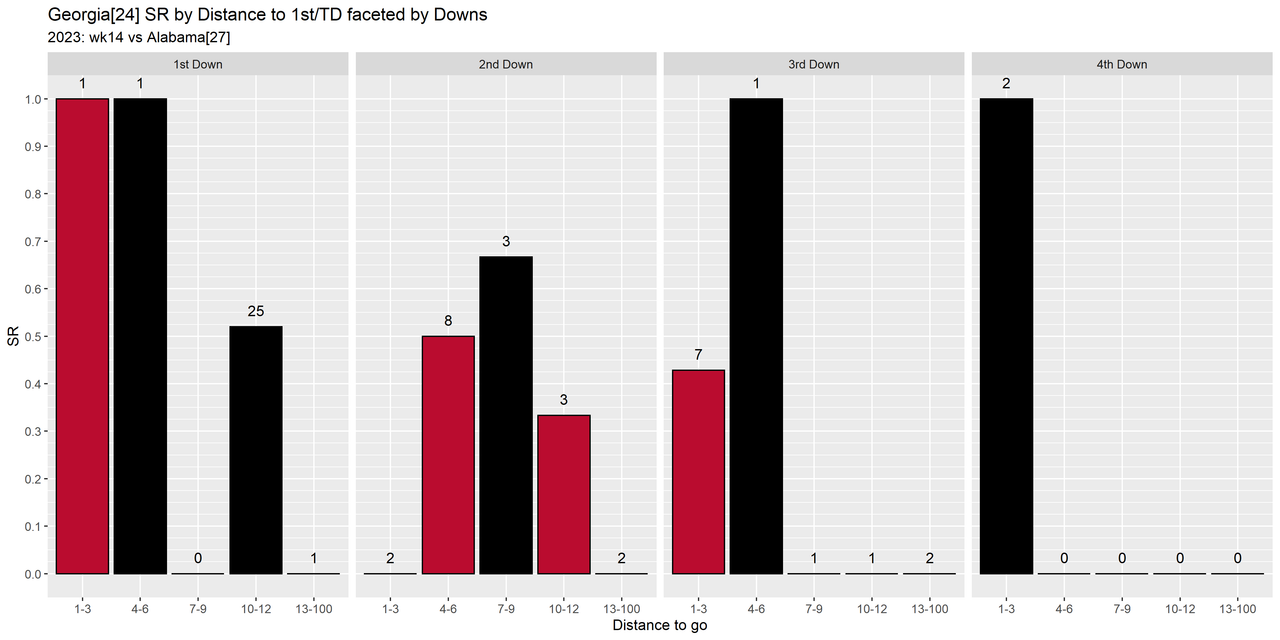
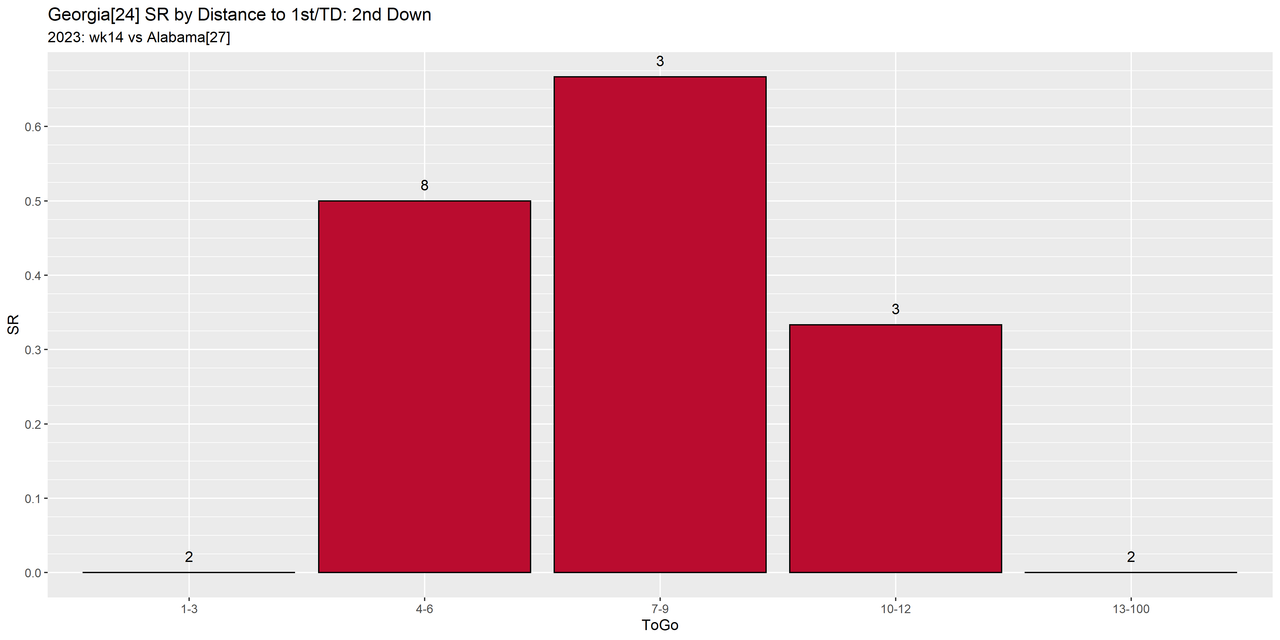
Georgia was a little better than us on 1st down with a SR = 0.536,
on second down a little worse SR = 0.389,
and a little better on 3rd with SR = 0.333.
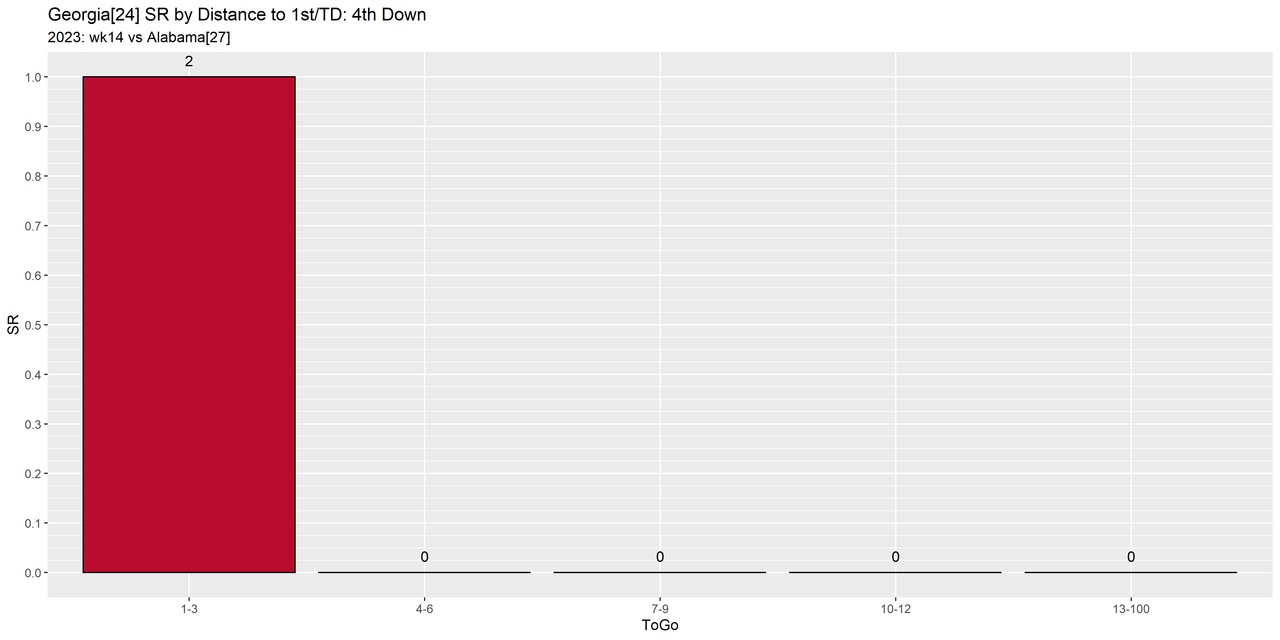
And like us they had two 4th down plays and with SR = 1.000.
Their ESR on 1st down ESR_1 = 0.600
and ESR_2 = 0.571.
Is this ESR meaningful?
I'll need more time to think about it and experience,
but even though our ESR_1 might be low our ESR_2 was definitely high.
For Georgia both of their ESRs were above 0.500.
One thing I think this will measure is what percentage of plays will be 1st, 2nd, and 3rd downs.
So it looks like even though they spent more time on 1st downs
and we spent more time on 2nd downs,
we both had about the same percentage of 3rd downs (see table below).
Since a successful 3rd down play is a 1st down or a TD,
their higher SR on 3rd would again show that they were more consistent.
Percentage of play by down: Georgia, 2023, week 14, season regular, Opponent: Alabama
| Down |
1st |
2nd |
3rd |
4th |
| Alabama |
0.422 |
0.344 |
0.203 |
0.031 |
| Georgia |
0.467 |
0.300 |
0.200 |
0.033 |
Success by down: Georgia, 2023, week 14, season regular, Opponent: Alabama
| 1 |
15 |
13 |
28 |
9 |
| 2 |
7 |
11 |
18 |
4 |
| 3 |
4 |
8 |
12 |
4 |
| 4 |
2 |
0 |
2 |
2 |
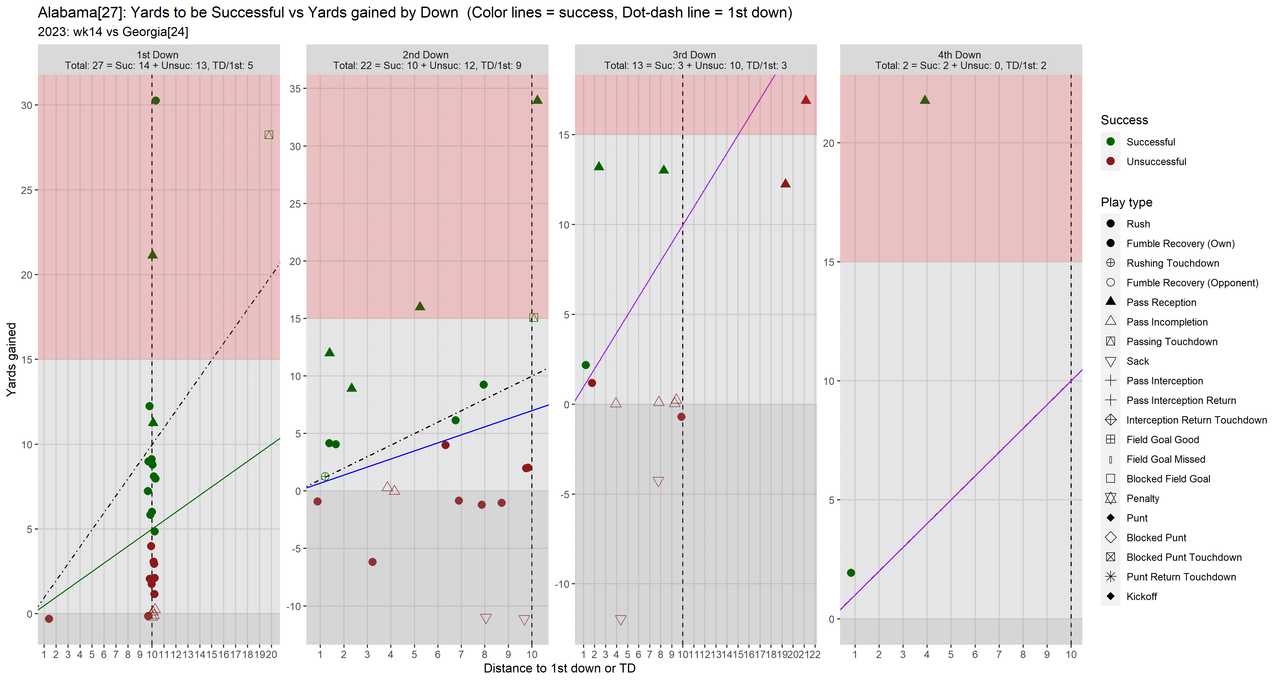
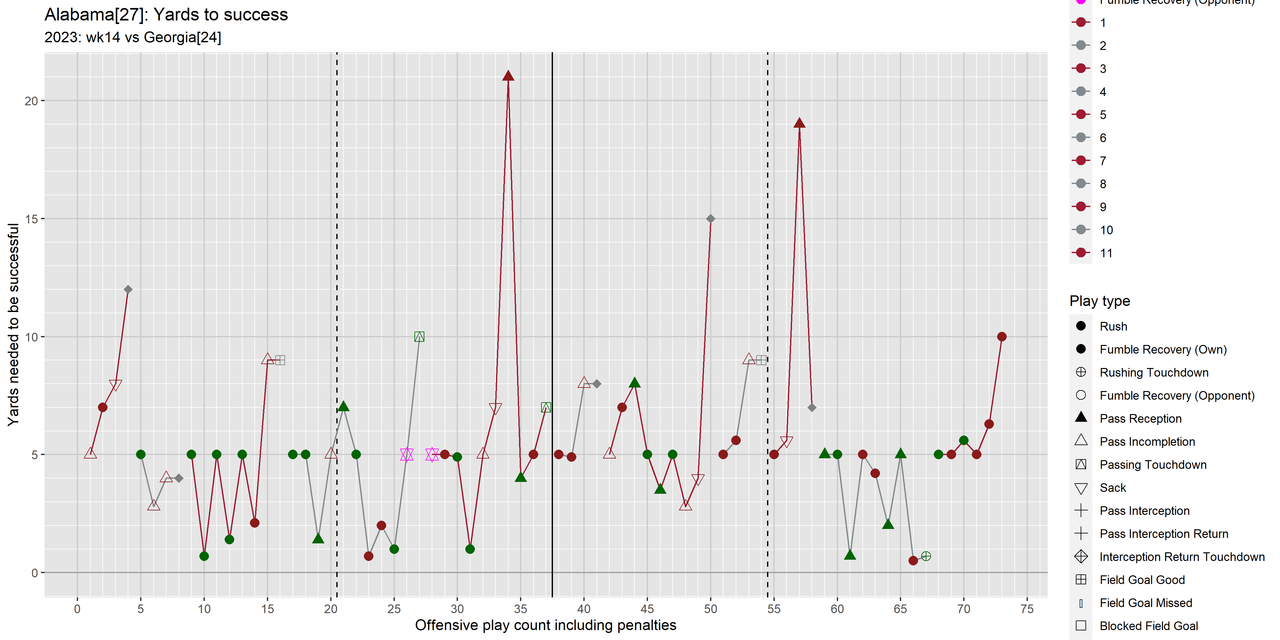
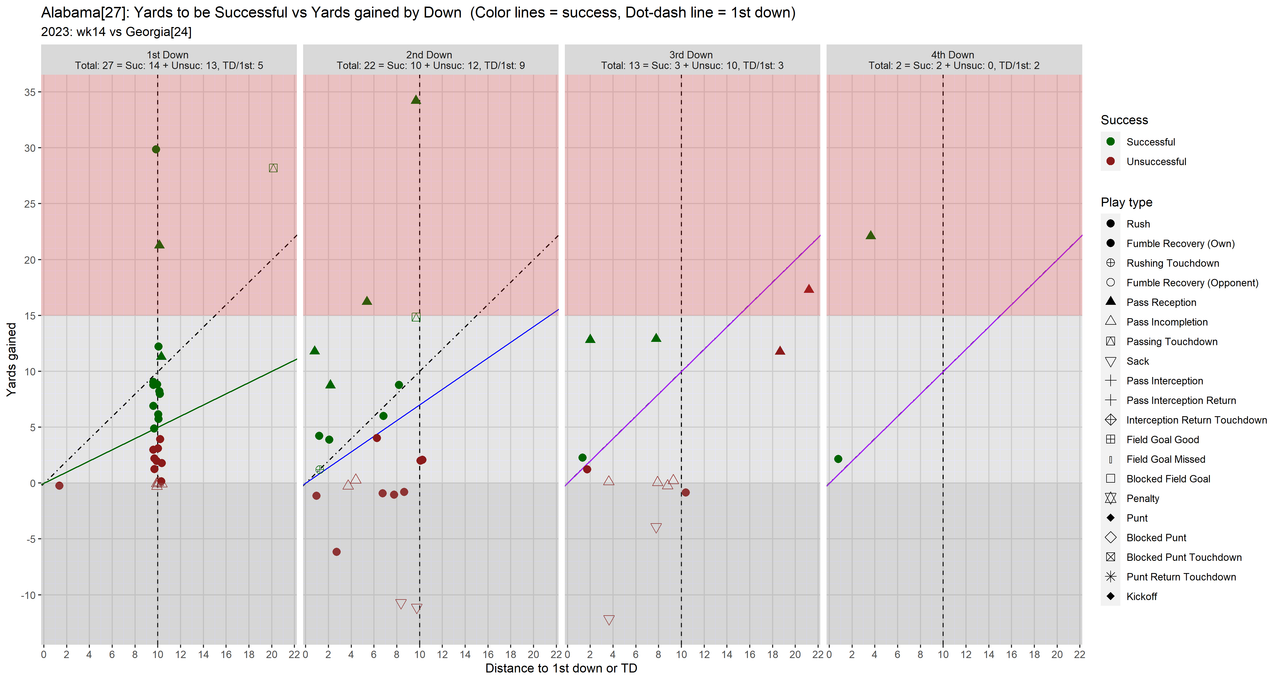
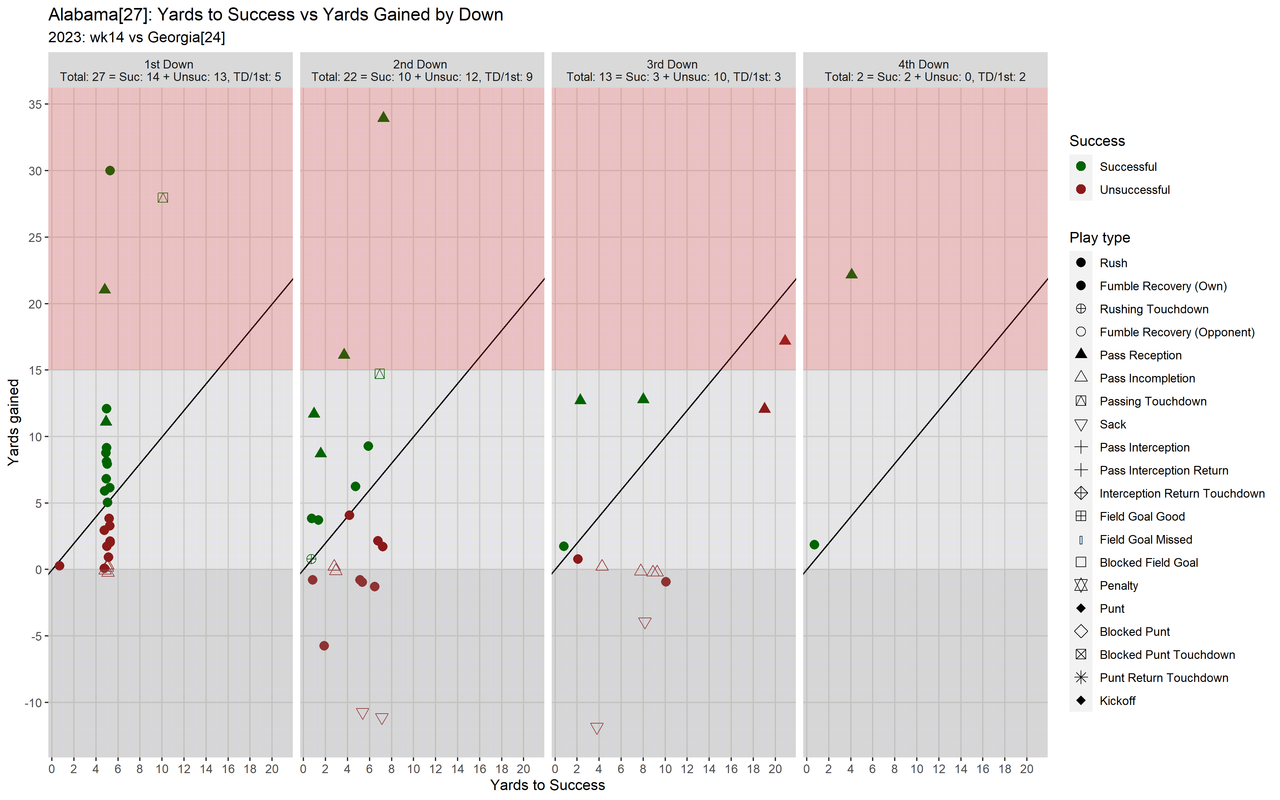
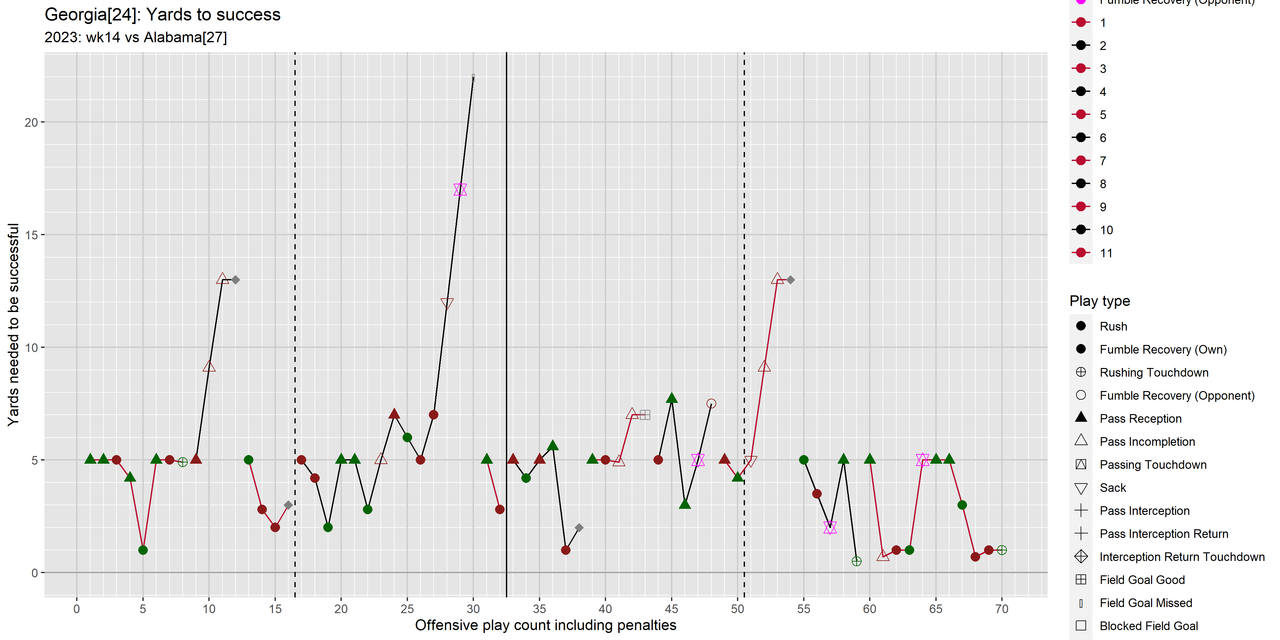
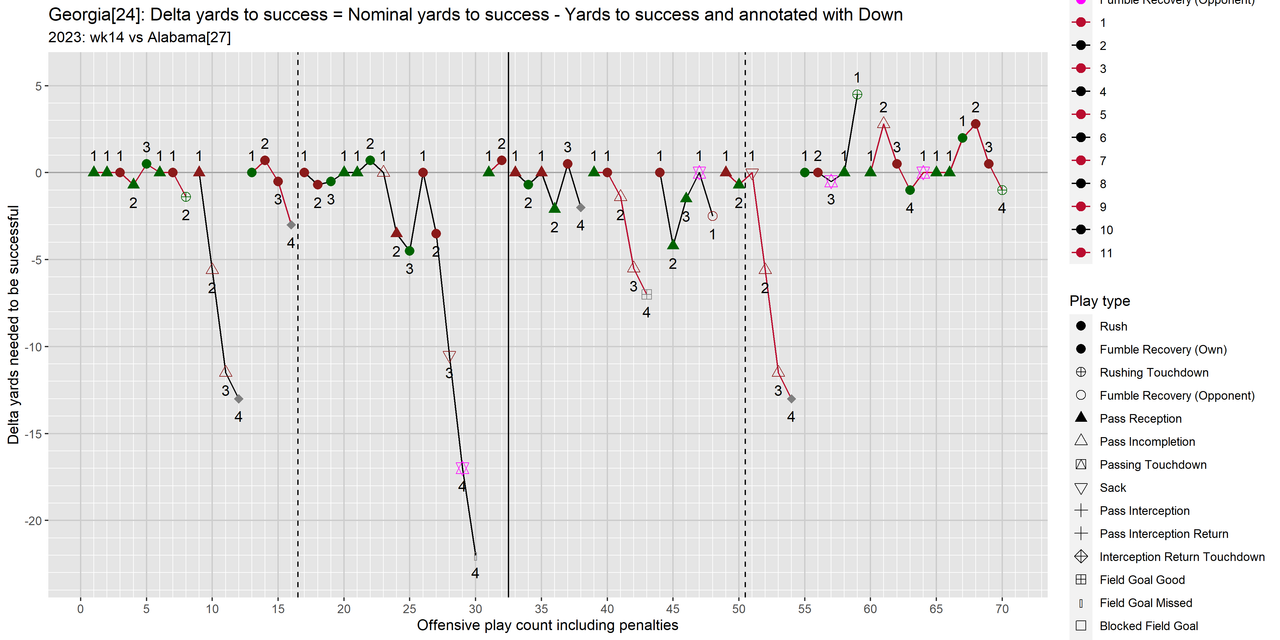
It can't be good when your average/median distance to a 1st/TD is bigger on 3rd down than on 2nd down.
I've not mentioned the Yards Gained by down graph much,
but in this game it is notable that on 3rd down with an 8 yard mean/median distance to a 1st/TD
the mean gained was 3.2 yards and the median was 0.
No matter how you look at it we were just bad on 3rd down.
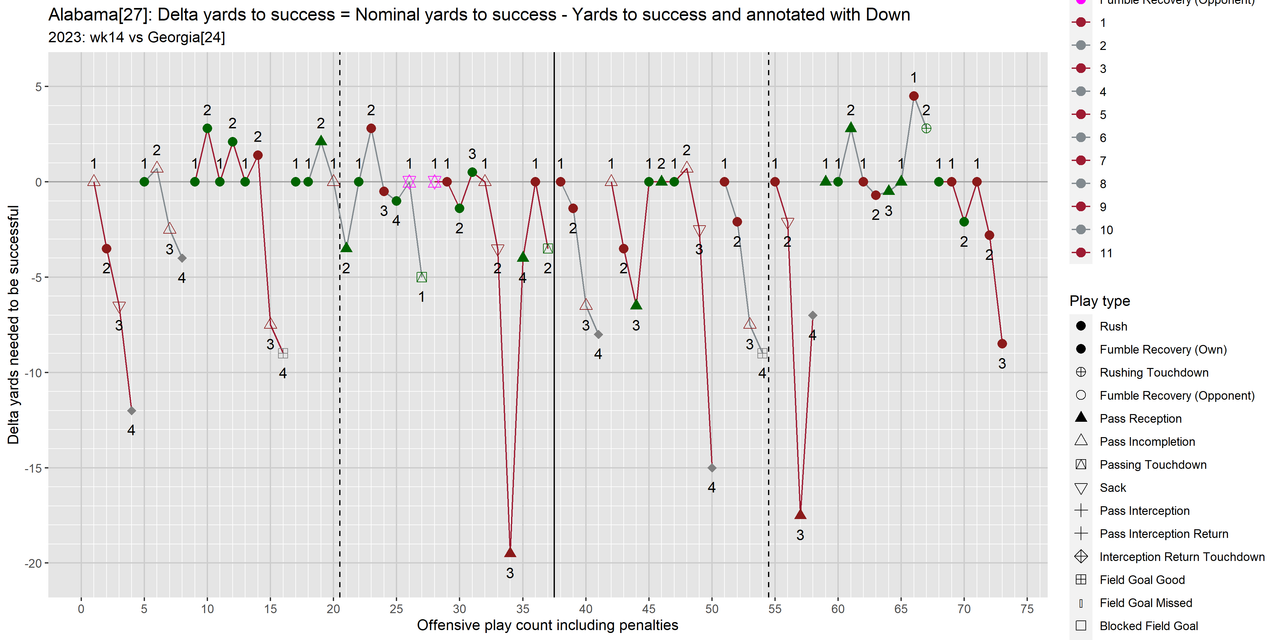
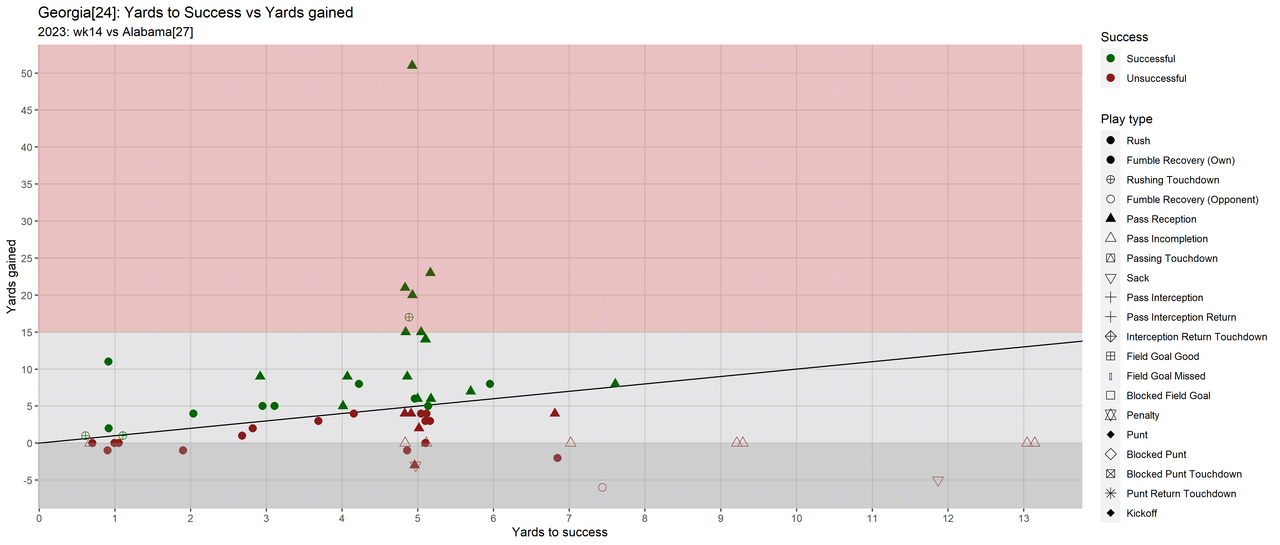
Note on the graphs below,
for some reason the outliers are being double plotted.
Distance to 1st/TD, Yards gained statistics by down: Alabama, 2023, week 14, season regular, Opponent: Georgia
| 1 |
27 |
0 |
10.037 |
2.6382 |
10.0 |
6.88889 |
8.02081 |
5.0 |
| 2 |
22 |
5 |
5.77273 |
3.46316 |
6.5 |
3.90909 |
9.71454 |
2.0 |
| 3 |
13 |
9 |
8.07692 |
6.11639 |
8.0 |
3.15385 |
8.20413 |
0.0 |
| 4 |
2 |
11 |
2.5 |
2.12132 |
2.5 |
12.0 |
14.1421 |
12.0 |

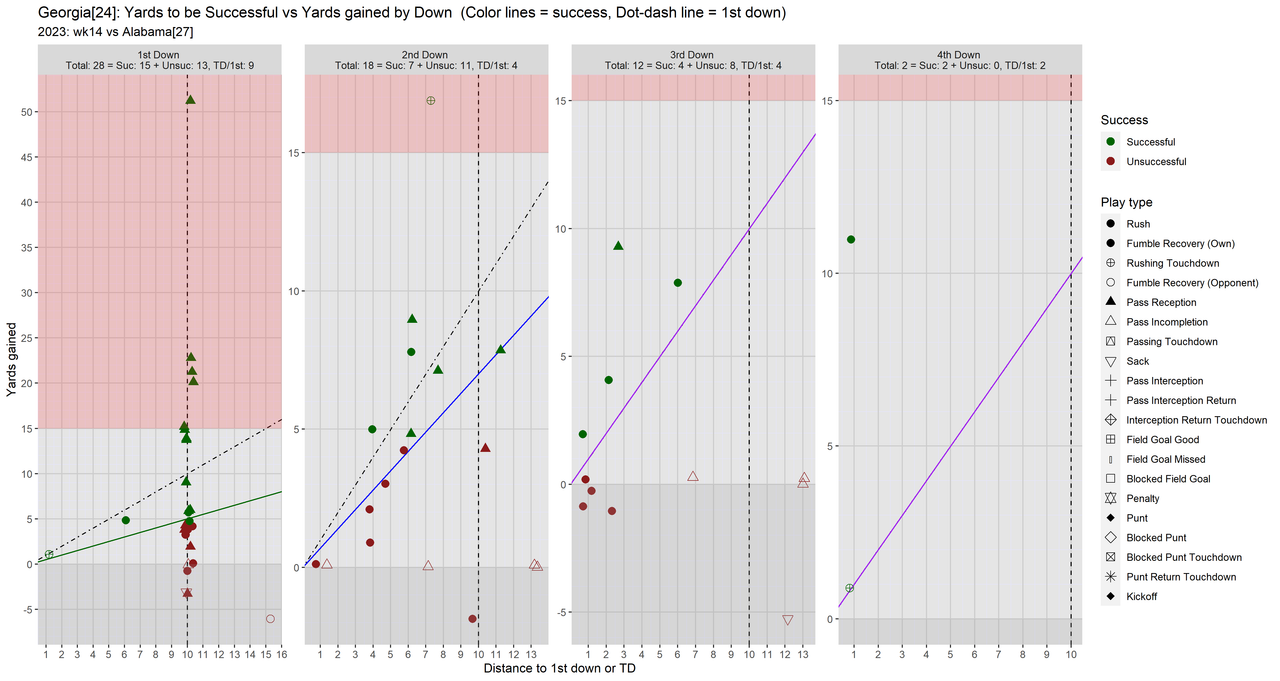
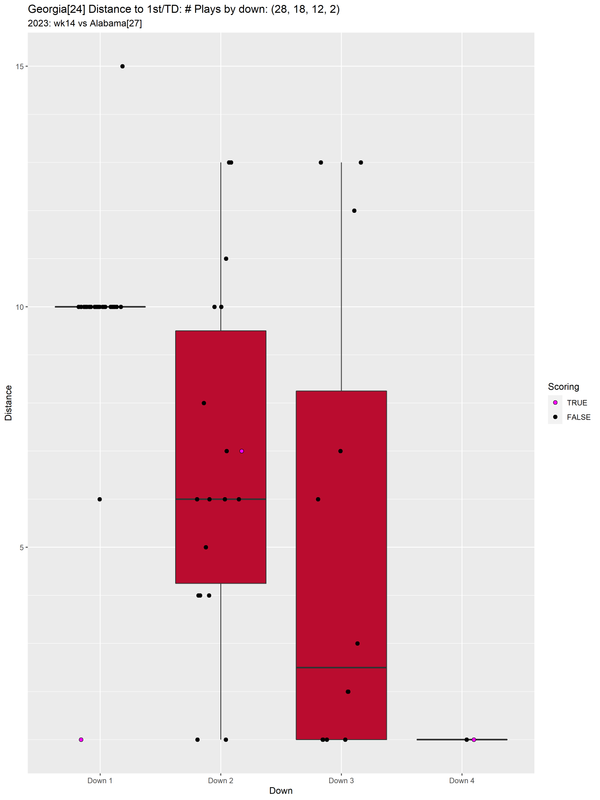
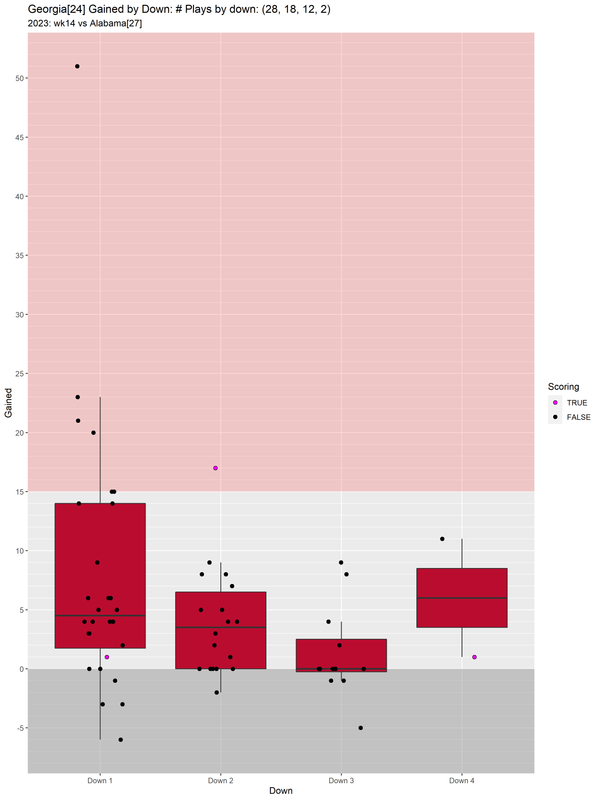
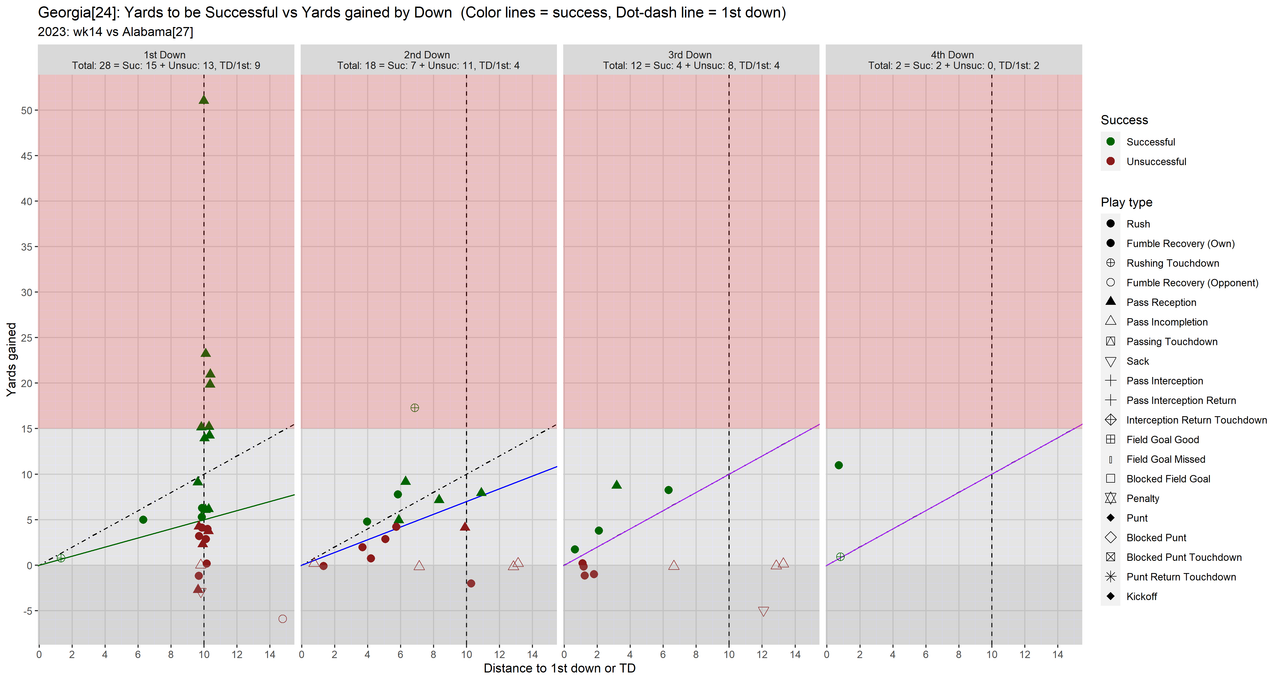
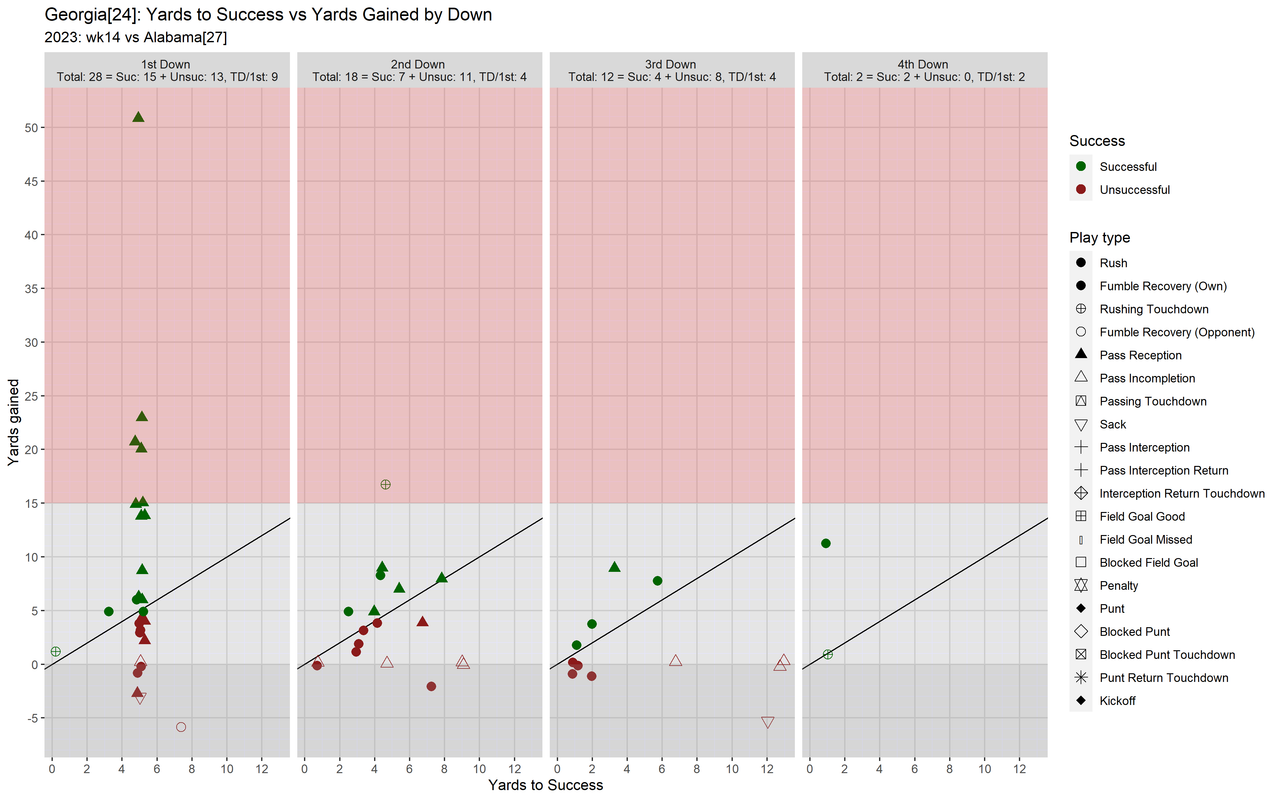
Georgia's Distance to 1st/TD has the look that I associate with a team playing well
in that their mean and median distance to a 1st/TD decreased from 1st down to 3rd down.
But like us their their mean gained on 3rd down was actually lower than ours at 1.33 and also had a median of 0.
This can be seen in the Gained by Down box and whisker plot below.
Distance to 1st/TD, Yards gained statistics by down: Georgia, 2023, week 14, season regular, Opponent: Alabama
| 1 |
28 |
0 |
9.71429 |
2.10567 |
10.0 |
7.92857 |
11.2774 |
4.5 |
| 2 |
18 |
10 |
6.77778 |
3.54061 |
6.0 |
3.94444 |
4.64596 |
3.5 |
| 3 |
12 |
6 |
5.16667 |
4.93288 |
2.5 |
1.33333 |
3.93893 |
0.0 |
| 4 |
2 |
10 |
1.0 |
0.0 |
1.0 |
6.0 |
7.07107 |
6.0 |
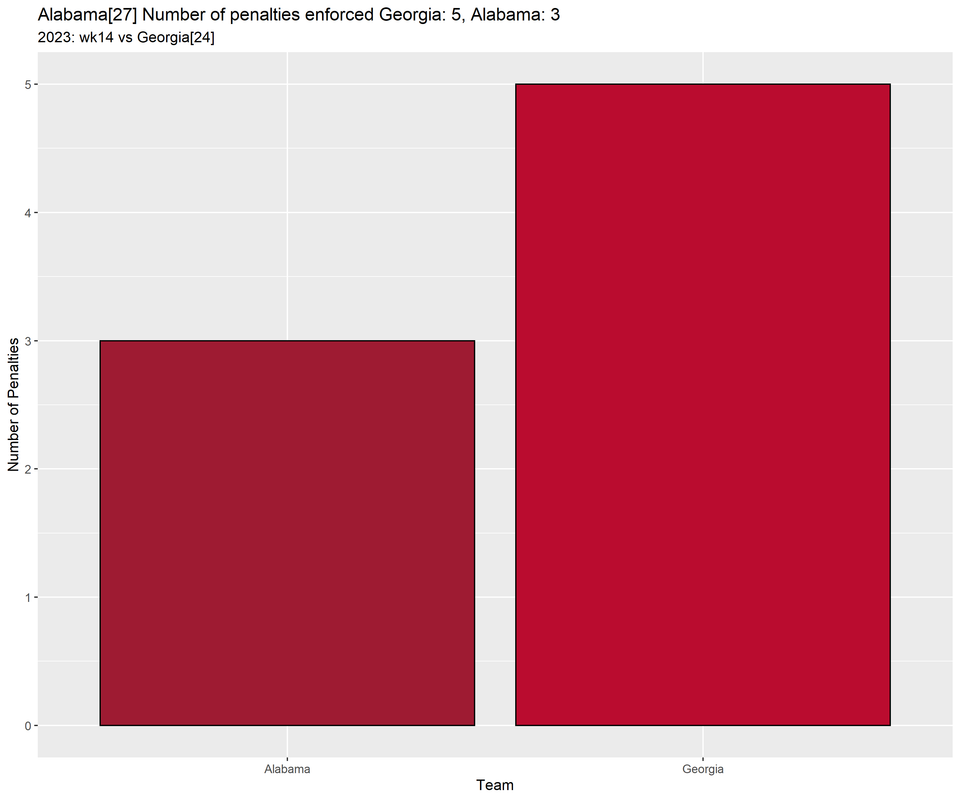
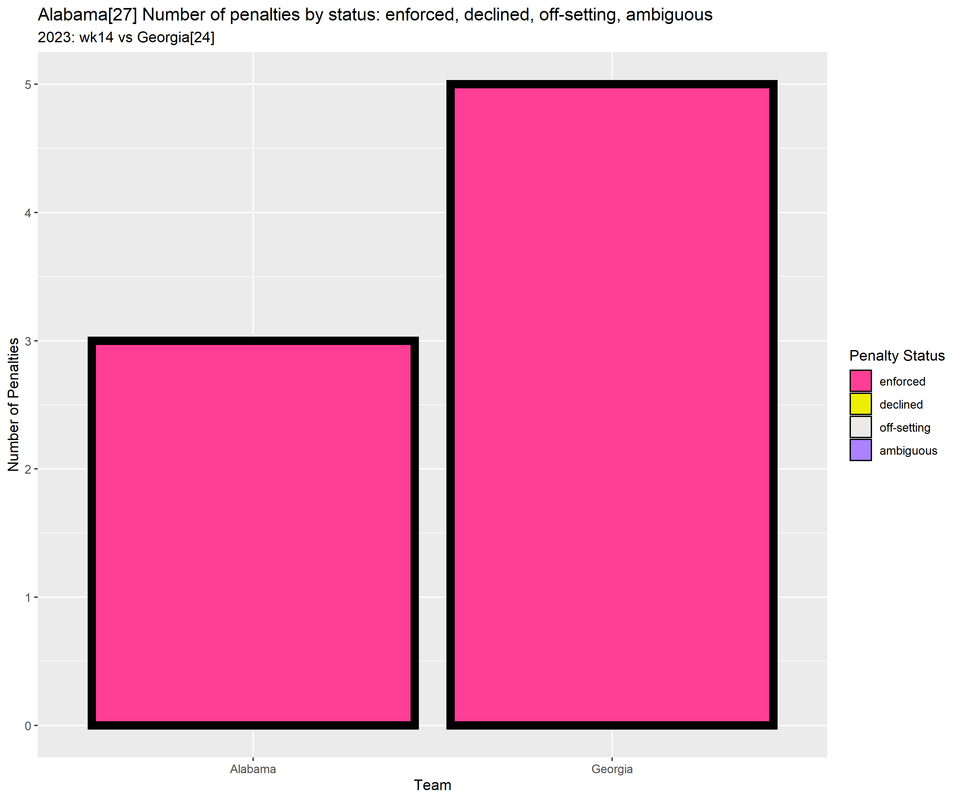
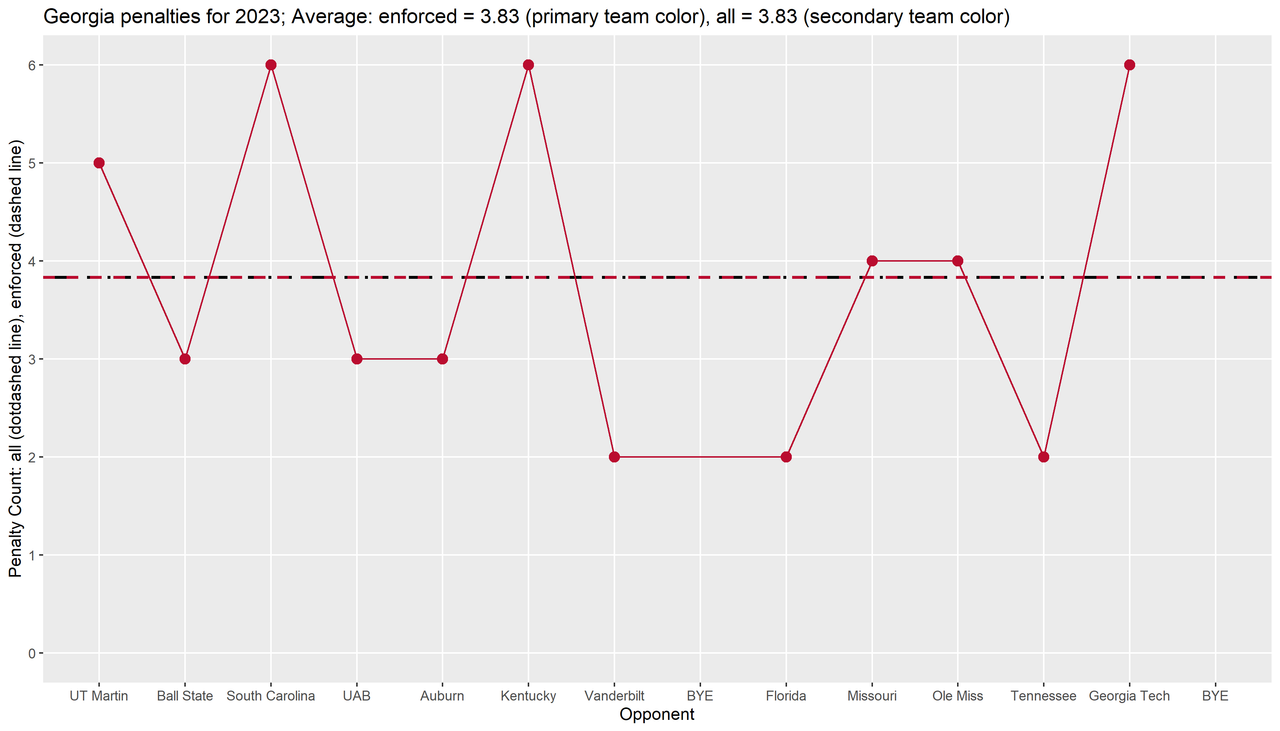
On surprise for me was the penalties.
We had been averaging 5.77 penalties per game
and Georgia was averaging 4.38 penalties per game,
but we were the less penalized team in this game.
It wasn't by much,
we had 4 penalties called against us but only 3 enforced
and Georgia had 5.
And one of our penalties was apparently for being too good at blocking in the middle of the line!
One of several improvements I want to make in the time after the NCG is to add yards
and home vs away data to the penalties.
But it felt good to have fewer penalties vs an opponent
especially one who had be penalized so seldom this season.
Penalties: 2023, week 14, season regular
| Alabama |
Ineligible Receiver Downfield |
declined |
| Alabama |
Holding |
enforced |
| Alabama |
Pass Interference |
enforced |
| Alabama |
Face Mask |
enforced |
| Georgia |
Face Mask |
enforced |
| Georgia |
False Start |
enforced |
| Georgia |
Pass Interference |
enforced |
| Georgia |
Horse Collar Tackle |
enforced |
| Georgia |
False Start |
enforced |

| Tennessee |
98 |
8.17 |
0.65 |
| Ole Miss |
88 |
7.33 |
0.36 |
| Missouri |
86 |
7.17 |
0.30 |
| South Carolina |
85 |
7.08 |
0.27 |
| Florida |
79 |
6.58 |
0.10 |
| Arkansas |
76 |
6.33 |
0.01 |
| Kentucky |
75 |
6.25 |
-0.02 |
| Mississippi State |
75 |
6.25 |
-0.02 |
| Texas A&M |
75 |
6.25 |
-0.02 |
| LSU |
74 |
6.17 |
-0.05 |
| Alabama |
75 |
5.77 |
-0.19 |
| Auburn |
67 |
5.58 |
-0.25 |
| Vanderbilt |
56 |
5.09 |
-0.42 |
| Georgia |
57 |
4.38 |
-0.67 |
I hope I have two more chances to practice improving my writing and analysis this season.
Roll Tide!

Success by drive: Alabama, 2023, week 14, season regular, Opponent: Georgia
| 1 |
3 |
0 |
3 |
0.0 |
Neither |
| 2 |
3 |
1 |
2 |
0.333333 |
Neither |
| 3 |
7 |
5 |
2 |
0.714286 |
Neither |
| 4 |
10 |
7 |
3 |
0.7 |
Score |
| 5 |
9 |
4 |
5 |
0.444444 |
Score |
| 6 |
3 |
0 |
3 |
0.0 |
Neither |
| 7 |
8 |
4 |
4 |
0.5 |
Neither |
| 8 |
3 |
0 |
3 |
0.0 |
Neither |
| 9 |
3 |
0 |
3 |
0.0 |
Neither |
| 10 |
9 |
6 |
3 |
0.666667 |
Score |
| 11 |
6 |
2 |
4 |
0.333333 |
Neither |
Mean drive SR by week: Alabama, 2023
| wk01 |
0.545 |
0.562 |
0.141 |
Middle Tennessee |
| wk02 |
0.286 |
0.355 |
0.145 |
Texas |
| wk03 |
0.336 |
0.385 |
0.077 |
South Florida |
| wk04 |
0.362 |
0.446 |
0.123 |
Ole Miss |
| wk05 |
0.395 |
0.482 |
0.161 |
Mississippi State |
| wk06 |
0.312 |
0.344 |
0.148 |
Texas A&M |
| wk07 |
0.3 |
0.375 |
0.172 |
Arkansas |
| wk08 |
0.383 |
0.397 |
0.143 |
Tennessee |
| wk10 |
0.567 |
0.536 |
0.174 |
LSU |
| wk11 |
0.528 |
0.508 |
0.154 |
Kentucky |
| wk12 |
0.471 |
0.544 |
0.211 |
Chattanooga |
| wk13 |
0.398 |
0.484 |
0.141 |
Auburn |
SR/XR, Mean SR/XR: 2023, season: regular after week 14, Alabama vs Georgia
| Alabama |
0.453 |
0.452 |
0.125 |
0.149 |
| Georgia |
0.467 |
0.52 |
0.117 |
0.161 |
Success by down: Alabama, 2023, week 14, season regular, Opponent: Georgia
| 1 |
14 |
13 |
27 |
5 |
| 2 |
10 |
12 |
22 |
9 |
| 3 |
3 |
10 |
13 |
3 |
| 4 |
2 |
0 |
2 |
2 |
3rd down Successful/Unsuccessful: Alabama, 2023, week 14, season regular, Opponent: Georgia
| 1 |
45 |
Successful |
| 2 |
21 |
Unsuccessful |
| 2 |
25 |
Successful |
| 4 |
33 |
Unsuccessful |
| 4 |
69 |
Unsuccessful |
| 8 |
63 |
Unsuccessful |
| 8 |
73 |
Successful |
| 8 |
78 |
Unsuccessful |
| 9 |
10 |
Unsuccessful |
| 9 |
25 |
Unsuccessful |
| 10 |
34 |
Unsuccessful |
| 19 |
89 |
Unsuccessful |
| 21 |
54 |
Unsuccessful |
Distance to 1st/TD, Yards gained statistics by down: Alabama, 2023, week 14, season regular, Opponent: Georgia
| 1 |
27 |
0 |
10.037 |
2.6382 |
10.0 |
6.88889 |
8.02081 |
5.0 |
| 2 |
22 |
5 |
5.77273 |
3.46316 |
6.5 |
3.90909 |
9.71454 |
2.0 |
| 3 |
13 |
9 |
8.07692 |
6.11639 |
8.0 |
3.15385 |
8.20413 |
0.0 |
| 4 |
2 |
11 |
2.5 |
2.12132 |
2.5 |
12.0 |
14.1421 |
12.0 |


Penalties: 2023, week 14, season regular
| Alabama |
Ineligible Receiver Downfield |
declined |
| Alabama |
Holding |
enforced |
| Alabama |
Pass Interference |
enforced |
| Alabama |
Face Mask |
enforced |
| Georgia |
Face Mask |
enforced |
| Georgia |
False Start |
enforced |
| Georgia |
Pass Interference |
enforced |
| Georgia |
Horse Collar Tackle |
enforced |
| Georgia |
False Start |
enforced |

Success by drive: Georgia, 2023, week 14, season regular, Opponent: Alabama
| 1 |
8 |
6 |
2 |
0.75 |
Score |
| 2 |
3 |
0 |
3 |
0.0 |
Neither |
| 3 |
3 |
1 |
2 |
0.333333 |
Neither |
| 4 |
12 |
5 |
7 |
0.416667 |
Neither |
| 5 |
2 |
1 |
1 |
0.5 |
Neither |
| 6 |
5 |
2 |
3 |
0.4 |
Neither |
| 7 |
4 |
1 |
3 |
0.25 |
Neither |
| 8 |
4 |
2 |
2 |
0.5 |
Turnover |
| 9 |
5 |
1 |
4 |
0.2 |
Neither |
| 10 |
4 |
3 |
1 |
0.75 |
Score |
| 11 |
10 |
6 |
4 |
0.6 |
Score |
Mean drive SR by week: Georgia, 2023
| wk01 |
0.41 |
0.471 |
0.186 |
UT Martin |
| wk02 |
0.472 |
0.492 |
0.164 |
Ball State |
| wk03 |
0.537 |
0.564 |
0.077 |
South Carolina |
| wk04 |
0.602 |
0.592 |
0.171 |
UAB |
| wk05 |
0.289 |
0.435 |
0.145 |
Auburn |
| wk06 |
0.597 |
0.589 |
0.151 |
Kentucky |
| wk07 |
0.507 |
0.506 |
0.13 |
Vanderbilt |
| wk09 |
0.397 |
0.455 |
0.197 |
Florida |
| wk10 |
0.353 |
0.385 |
0.169 |
Missouri |
| wk11 |
0.625 |
0.667 |
0.167 |
Ole Miss |
| wk12 |
0.378 |
0.479 |
0.169 |
Tennessee |
| wk13 |
0.509 |
0.61 |
0.203 |
Georgia Tech |
SR/XR, Mean SR/XR: 2023, season: regular after week 14, Alabama vs Georgia
| Alabama |
0.453 |
0.452 |
0.125 |
0.149 |
| Georgia |
0.467 |
0.52 |
0.117 |
0.161 |
Success by down: Georgia, 2023, week 14, season regular, Opponent: Alabama
| 1 |
15 |
13 |
28 |
9 |
| 2 |
7 |
11 |
18 |
4 |
| 3 |
4 |
8 |
12 |
4 |
| 4 |
2 |
0 |
2 |
2 |
3rd down Successful/Unsuccessful: Georgia, 2023, week 14, season regular, Opponent: Alabama
| 1 |
1 |
Unsuccessful |
| 1 |
37 |
Successful |
| 1 |
54 |
Unsuccessful |
| 1 |
66 |
Unsuccessful |
| 2 |
67 |
Successful |
| 2 |
67 |
Unsuccessful |
| 3 |
87 |
Successful |
| 6 |
27 |
Successful |
| 7 |
16 |
Unsuccessful |
| 12 |
21 |
Unsuccessful |
| 13 |
65 |
Unsuccessful |
| 13 |
90 |
Unsuccessful |
Distance to 1st/TD, Yards gained statistics by down: Georgia, 2023, week 14, season regular, Opponent: Alabama
| 1 |
28 |
0 |
9.71429 |
2.10567 |
10.0 |
7.92857 |
11.2774 |
4.5 |
| 2 |
18 |
10 |
6.77778 |
3.54061 |
6.0 |
3.94444 |
4.64596 |
3.5 |
| 3 |
12 |
6 |
5.16667 |
4.93288 |
2.5 |
1.33333 |
3.93893 |
0.0 |
| 4 |
2 |
10 |
1.0 |
0.0 |
1.0 |
6.0 |
7.07107 |
6.0 |


Penalties: 2023, week 14, season regular
| Alabama |
Ineligible Receiver Downfield |
declined |
| Alabama |
Holding |
enforced |
| Alabama |
Pass Interference |
enforced |
| Alabama |
Face Mask |
enforced |
| Georgia |
Face Mask |
enforced |
| Georgia |
False Start |
enforced |
| Georgia |
Pass Interference |
enforced |
| Georgia |
Horse Collar Tackle |
enforced |
| Georgia |
False Start |
enforced |
All SEC teams
All data below includes intra-conference games and OOC games.
Summary statistics for FBS conferences
| FBS |
5.87 |
2.75 |
0 |
4.0 |
6.0 |
8.0 |
18 |
| ACC |
6.12 |
3.02 |
0 |
4.0 |
6.0 |
8.0 |
18 |
| American Athletic |
5.37 |
2.71 |
0 |
3.0 |
5.0 |
7.0 |
14 |
| Big 12 |
5.40 |
2.27 |
1 |
4.0 |
5.0 |
7.0 |
11 |
| Big Ten |
5.05 |
2.65 |
0 |
3.0 |
5.0 |
6.0 |
14 |
| Conference USA |
5.97 |
2.36 |
1 |
4.0 |
6.0 |
7.0 |
13 |
| FBS Independents |
5.89 |
2.96 |
0 |
4.0 |
6.0 |
8.0 |
12 |
| Mid-American |
5.94 |
2.61 |
0 |
4.0 |
6.0 |
8.0 |
12 |
| Mountain West |
5.83 |
3.47 |
0 |
3.0 |
5.0 |
8.0 |
17 |
| Pac-12 |
6.60 |
2.84 |
2 |
5.0 |
6.0 |
8.0 |
17 |
| SEC |
6.31 |
2.86 |
0 |
4.0 |
6.0 |
8.0 |
14 |
| Sun Belt |
5.94 |
2.50 |
1 |
4.0 |
6.0 |
8.0 |
14 |
ACC
| 0 |
missing |
missing |
missing |
missing |
missing |
missing |
missing |
missing |
missing |
missing |
missing |
missing |
missing |
missing |
| 1 |
10 |
1 |
7 |
7 |
2 |
7 |
8 |
1 |
7 |
7 |
7 |
2 |
4 |
4 |
| 2 |
10 |
4 |
4 |
3 |
3 |
7 |
10 |
8 |
5 |
5 |
9 |
8 |
3 |
3 |
| 3 |
18 |
5 |
1 |
5 |
0 |
6 |
5 |
6 |
5 |
9 |
9 |
7 |
7 |
6 |
| 4 |
7 |
6 |
8 |
7 |
14 |
4 |
7 |
7 |
3 |
11 |
6 |
7 |
9 |
2 |
| 5 |
5 |
6 |
2 |
missing |
6 |
10 |
missing |
10 |
missing |
9 |
9 |
11 |
10 |
missing |
| 6 |
3 |
6 |
missing |
12 |
11 |
6 |
6 |
6 |
5 |
missing |
7 |
5 |
6 |
3 |
| 7 |
missing |
missing |
6 |
6 |
missing |
5 |
7 |
11 |
14 |
8 |
2 |
missing |
8 |
5 |
| 8 |
5 |
7 |
7 |
8 |
5 |
missing |
8 |
missing |
6 |
13 |
missing |
6 |
missing |
4 |
| 9 |
4 |
4 |
10 |
9 |
3 |
4 |
2 |
2 |
8 |
5 |
7 |
0 |
5 |
5 |
| 10 |
2 |
0 |
5 |
6 |
8 |
6 |
6 |
5 |
10 |
11 |
9 |
4 |
6 |
5 |
| 11 |
4 |
6 |
8 |
3 |
4 |
7 |
7 |
2 |
3 |
3 |
5 |
13 |
5 |
4 |
| 12 |
8 |
7 |
1 |
8 |
3 |
4 |
5 |
6 |
10 |
4 |
12 |
12 |
4 |
4 |
| 13 |
3 |
6 |
8 |
5 |
3 |
3 |
3 |
8 |
9 |
9 |
6 |
3 |
10 |
4 |
| 14 |
missing |
missing |
missing |
3 |
missing |
6 |
missing |
missing |
missing |
missing |
missing |
missing |
missing |
missing |
| Pittsburgh |
94 |
7.83 |
0.57 |
| Syracuse |
88 |
7.33 |
0.40 |
| North Carolina |
85 |
7.08 |
0.32 |
| Boston College |
79 |
6.58 |
0.15 |
| Virginia |
78 |
6.50 |
0.13 |
| Virginia Tech |
77 |
6.42 |
0.10 |
| Florida State |
82 |
6.31 |
0.06 |
| Miami |
74 |
6.17 |
0.02 |
| NC State |
72 |
6.00 |
-0.04 |
| Louisville |
75 |
5.77 |
-0.12 |
| Duke |
67 |
5.58 |
-0.18 |
| Georgia Tech |
62 |
5.17 |
-0.31 |
| Clemson |
58 |
4.83 |
-0.43 |
| Wake Forest |
49 |
4.08 |
-0.67 |
American Athletic
| 0 |
missing |
missing |
missing |
missing |
missing |
missing |
missing |
missing |
missing |
missing |
missing |
missing |
missing |
missing |
| 1 |
6 |
10 |
3 |
5 |
3 |
2 |
5 |
6 |
11 |
3 |
7 |
4 |
5 |
8 |
| 2 |
6 |
11 |
5 |
3 |
4 |
3 |
4 |
2 |
14 |
7 |
2 |
7 |
4 |
1 |
| 3 |
7 |
11 |
6 |
3 |
2 |
9 |
6 |
7 |
5 |
9 |
4 |
7 |
9 |
5 |
| 4 |
7 |
5 |
6 |
5 |
missing |
missing |
6 |
4 |
9 |
6 |
9 |
3 |
4 |
5 |
| 5 |
7 |
6 |
missing |
5 |
8 |
6 |
10 |
8 |
1 |
3 |
5 |
2 |
3 |
missing |
| 6 |
missing |
missing |
1 |
missing |
7 |
0 |
6 |
missing |
9 |
2 |
missing |
5 |
11 |
8 |
| 7 |
5 |
7 |
4 |
5 |
6 |
3 |
missing |
2 |
5 |
3 |
7 |
missing |
11 |
6 |
| 8 |
9 |
1 |
3 |
5 |
4 |
2 |
2 |
4 |
7 |
5 |
4 |
3 |
1 |
8 |
| 9 |
12 |
5 |
5 |
4 |
missing |
7 |
4 |
3 |
missing |
missing |
5 |
3 |
missing |
6 |
| 10 |
4 |
2 |
2 |
7 |
7 |
4 |
10 |
7 |
7 |
0 |
7 |
10 |
8 |
4 |
| 11 |
9 |
2 |
1 |
4 |
8 |
9 |
5 |
3 |
10 |
7 |
1 |
4 |
5 |
5 |
| 12 |
4 |
4 |
2 |
6 |
7 |
5 |
6 |
3 |
6 |
3 |
2 |
4 |
9 |
7 |
| 13 |
7 |
6 |
3 |
1 |
7 |
7 |
3 |
3 |
4 |
6 |
6 |
9 |
10 |
5 |
| 14 |
missing |
missing |
missing |
missing |
missing |
missing |
missing |
6 |
missing |
missing |
6 |
missing |
missing |
missing |
| South Florida |
88 |
7.33 |
0.72 |
| Charlotte |
83 |
6.92 |
0.57 |
| UAB |
80 |
6.67 |
0.48 |
| East Carolina |
70 |
5.83 |
0.17 |
| Navy |
63 |
5.73 |
0.13 |
| UT San Antonio |
68 |
5.67 |
0.11 |
| Rice |
67 |
5.58 |
0.08 |
| Tulsa |
61 |
5.08 |
-0.11 |
| Tulane |
65 |
5.00 |
-0.14 |
| North Texas |
57 |
4.75 |
-0.23 |
| Temple |
54 |
4.50 |
-0.32 |
| SMU |
58 |
4.46 |
-0.34 |
| Memphis |
53 |
4.42 |
-0.35 |
| Florida Atlantic |
41 |
3.42 |
-0.72 |
Big 12
| 0 |
missing |
missing |
missing |
missing |
missing |
missing |
missing |
missing |
missing |
missing |
missing |
missing |
missing |
missing |
| 1 |
9 |
8 |
7 |
3 |
9 |
3 |
4 |
6 |
5 |
10 |
5 |
7 |
7 |
5 |
| 2 |
5 |
3 |
7 |
6 |
2 |
4 |
5 |
9 |
9 |
5 |
4 |
6 |
4 |
4 |
| 3 |
2 |
7 |
10 |
7 |
5 |
7 |
7 |
7 |
7 |
7 |
6 |
2 |
7 |
4 |
| 4 |
4 |
3 |
2 |
11 |
5 |
7 |
5 |
8 |
3 |
6 |
2 |
9 |
10 |
3 |
| 5 |
4 |
4 |
7 |
4 |
6 |
3 |
missing |
5 |
missing |
7 |
4 |
1 |
7 |
2 |
| 6 |
1 |
missing |
missing |
missing |
1 |
2 |
4 |
4 |
5 |
6 |
9 |
4 |
5 |
missing |
| 7 |
missing |
5 |
6 |
7 |
5 |
3 |
5 |
missing |
3 |
7 |
missing |
5 |
missing |
8 |
| 8 |
5 |
4 |
4 |
1 |
missing |
missing |
6 |
6 |
7 |
4 |
6 |
9 |
7 |
5 |
| 9 |
2 |
3 |
4 |
6 |
4 |
5 |
1 |
11 |
4 |
missing |
6 |
missing |
6 |
4 |
| 10 |
7 |
10 |
8 |
6 |
7 |
8 |
7 |
8 |
4 |
5 |
10 |
8 |
3 |
10 |
| 11 |
4 |
4 |
2 |
3 |
6 |
4 |
5 |
5 |
5 |
6 |
7 |
4 |
4 |
2 |
| 12 |
1 |
7 |
5 |
10 |
4 |
5 |
2 |
6 |
5 |
4 |
7 |
7 |
8 |
5 |
| 13 |
5 |
6 |
6 |
4 |
6 |
4 |
6 |
5 |
5 |
7 |
9 |
5 |
4 |
5 |
| 14 |
missing |
missing |
missing |
missing |
missing |
missing |
missing |
missing |
3 |
missing |
7 |
missing |
missing |
missing |
| Oklahoma |
80 |
6.67 |
0.56 |
| Texas |
82 |
6.31 |
0.40 |
| TCU |
74 |
6.17 |
0.34 |
| UCF |
72 |
6.00 |
0.26 |
| Cincinnati |
68 |
5.67 |
0.12 |
| Houston |
68 |
5.67 |
0.12 |
| Texas Tech |
67 |
5.58 |
0.08 |
| BYU |
64 |
5.33 |
-0.03 |
| Iowa State |
60 |
5.00 |
-0.18 |
| Oklahoma State |
65 |
5.00 |
-0.18 |
| Kansas State |
57 |
4.75 |
-0.29 |
| West Virginia |
57 |
4.75 |
-0.29 |
| Kansas |
55 |
4.58 |
-0.36 |
| Baylor |
49 |
4.08 |
-0.58 |
Big Ten
| 0 |
missing |
missing |
missing |
missing |
missing |
missing |
missing |
missing |
missing |
missing |
missing |
missing |
missing |
missing |
| 1 |
10 |
8 |
7 |
6 |
5 |
8 |
3 |
7 |
3 |
5 |
1 |
4 |
2 |
3 |
| 2 |
6 |
7 |
0 |
4 |
4 |
5 |
2 |
6 |
4 |
6 |
7 |
7 |
5 |
4 |
| 3 |
6 |
4 |
1 |
7 |
1 |
11 |
3 |
5 |
1 |
5 |
7 |
11 |
4 |
8 |
| 4 |
6 |
5 |
4 |
4 |
3 |
6 |
5 |
6 |
8 |
5 |
4 |
7 |
5 |
11 |
| 5 |
9 |
4 |
3 |
4 |
0 |
10 |
1 |
4 |
4 |
missing |
6 |
3 |
4 |
missing |
| 6 |
3 |
missing |
2 |
4 |
1 |
missing |
4 |
10 |
8 |
10 |
missing |
6 |
4 |
2 |
| 7 |
5 |
5 |
5 |
5 |
2 |
5 |
missing |
missing |
missing |
9 |
6 |
5 |
6 |
7 |
| 8 |
9 |
5 |
6 |
missing |
7 |
11 |
7 |
3 |
8 |
6 |
5 |
missing |
6 |
6 |
| 9 |
missing |
5 |
missing |
6 |
missing |
4 |
3 |
6 |
8 |
6 |
6 |
9 |
missing |
5 |
| 10 |
4 |
2 |
3 |
4 |
1 |
7 |
2 |
0 |
7 |
5 |
7 |
5 |
3 |
8 |
| 11 |
14 |
7 |
0 |
10 |
6 |
5 |
2 |
1 |
5 |
3 |
5 |
6 |
7 |
5 |
| 12 |
6 |
6 |
6 |
5 |
2 |
3 |
1 |
7 |
4 |
5 |
1 |
5 |
6 |
4 |
| 13 |
1 |
8 |
2 |
5 |
3 |
6 |
3 |
5 |
5 |
1 |
4 |
4 |
8 |
3 |
| 14 |
missing |
missing |
7 |
missing |
3 |
missing |
missing |
missing |
missing |
missing |
missing |
missing |
missing |
missing |
| Michigan State |
81 |
6.75 |
0.64 |
| Illinois |
79 |
6.58 |
0.58 |
| Purdue |
72 |
6.00 |
0.36 |
| Indiana |
66 |
5.50 |
0.17 |
| Ohio State |
66 |
5.50 |
0.17 |
| Wisconsin |
66 |
5.50 |
0.17 |
| Northwestern |
65 |
5.42 |
0.14 |
| Maryland |
64 |
5.33 |
0.11 |
| Nebraska |
60 |
5.00 |
-0.02 |
| Rutgers |
60 |
5.00 |
-0.02 |
| Penn State |
59 |
4.92 |
-0.05 |
| Iowa |
46 |
3.54 |
-0.57 |
| Minnesota |
36 |
3.00 |
-0.77 |
| Michigan |
38 |
2.92 |
-0.80 |
Conference USA
| 0 |
5 |
7 |
missing |
5 |
missing |
6 |
missing |
10 |
missing |
| 1 |
missing |
missing |
4 |
missing |
9 |
missing |
7 |
missing |
9 |
| 2 |
6 |
7 |
7 |
8 |
6 |
6 |
2 |
6 |
4 |
| 3 |
8 |
missing |
10 |
5 |
12 |
7 |
missing |
6 |
3 |
| 4 |
5 |
4 |
4 |
12 |
6 |
3 |
10 |
8 |
3 |
| 5 |
missing |
6 |
missing |
13 |
7 |
missing |
8 |
9 |
8 |
| 6 |
5 |
4 |
8 |
7 |
6 |
4 |
3 |
missing |
4 |
| 7 |
5 |
7 |
7 |
7 |
7 |
8 |
3 |
4 |
missing |
| 8 |
5 |
2 |
8 |
missing |
5 |
7 |
8 |
8 |
1 |
| 9 |
9 |
1 |
4 |
5 |
missing |
5 |
3 |
7 |
7 |
| 10 |
missing |
7 |
10 |
7 |
7 |
8 |
2 |
6 |
4 |
| 11 |
6 |
missing |
4 |
5 |
4 |
7 |
5 |
missing |
2 |
| 12 |
5 |
3 |
3 |
2 |
5 |
9 |
5 |
7 |
5 |
| 13 |
3 |
9 |
8 |
missing |
7 |
6 |
5 |
6 |
4 |
| 14 |
missing |
missing |
5 |
missing |
missing |
7 |
missing |
missing |
missing |
| UTEP |
77 |
7.00 |
0.44 |
| Louisiana Tech |
76 |
6.91 |
0.40 |
| Middle Tennessee |
81 |
6.75 |
0.33 |
| New Mexico State |
83 |
6.38 |
0.18 |
| Liberty |
82 |
6.31 |
0.14 |
| Florida International |
62 |
5.64 |
-0.14 |
| Jacksonville State |
57 |
5.18 |
-0.33 |
| Sam Houston State |
61 |
5.08 |
-0.38 |
| Western Kentucky |
54 |
4.50 |
-0.62 |
FBS Independents
| 0 |
missing |
missing |
4 |
8 |
| 1 |
3 |
6 |
1 |
9 |
| 2 |
4 |
8 |
10 |
7 |
| 3 |
0 |
6 |
8 |
7 |
| 4 |
1 |
4 |
4 |
11 |
| 5 |
missing |
9 |
12 |
12 |
| 6 |
6 |
6 |
3 |
6 |
| 7 |
5 |
missing |
5 |
9 |
| 8 |
0 |
4 |
missing |
missing |
| 9 |
1 |
5 |
6 |
8 |
| 10 |
11 |
6 |
5 |
9 |
| 11 |
6 |
5 |
missing |
missing |
| 12 |
5 |
5 |
3 |
7 |
| 13 |
missing |
9 |
5 |
3 |
| 14 |
missing |
missing |
missing |
missing |
| UMass |
96 |
8.00 |
0.71 |
| Connecticut |
73 |
6.08 |
0.06 |
| Notre Dame |
66 |
5.50 |
-0.13 |
| Army |
42 |
3.82 |
-0.70 |
Mid-American
| 0 |
missing |
missing |
missing |
missing |
missing |
missing |
missing |
missing |
missing |
3 |
missing |
missing |
| 1 |
10 |
4 |
9 |
6 |
7 |
6 |
4 |
5 |
4 |
missing |
7 |
3 |
| 2 |
8 |
3 |
6 |
8 |
8 |
8 |
5 |
8 |
7 |
1 |
4 |
9 |
| 3 |
6 |
4 |
2 |
6 |
2 |
10 |
7 |
7 |
2 |
1 |
8 |
8 |
| 4 |
10 |
3 |
12 |
6 |
4 |
3 |
11 |
4 |
5 |
8 |
11 |
5 |
| 5 |
2 |
10 |
10 |
7 |
8 |
4 |
5 |
3 |
5 |
missing |
8 |
9 |
| 6 |
4 |
8 |
7 |
5 |
6 |
4 |
5 |
7 |
5 |
7 |
7 |
6 |
| 7 |
9 |
6 |
10 |
4 |
6 |
2 |
6 |
5 |
1 |
7 |
5 |
7 |
| 8 |
9 |
7 |
3 |
6 |
8 |
7 |
0 |
4 |
10 |
7 |
7 |
10 |
| 9 |
missing |
missing |
missing |
missing |
missing |
10 |
missing |
7 |
missing |
11 |
missing |
6 |
| 10 |
3 |
5 |
5 |
2 |
8 |
missing |
6 |
missing |
9 |
missing |
6 |
missing |
| 11 |
7 |
3 |
11 |
3 |
7 |
7 |
5 |
2 |
2 |
4 |
4 |
10 |
| 12 |
8 |
6 |
6 |
2 |
10 |
6 |
7 |
2 |
3 |
8 |
6 |
9 |
| 13 |
7 |
3 |
4 |
3 |
6 |
8 |
4 |
2 |
2 |
4 |
6 |
3 |
| 14 |
missing |
missing |
missing |
missing |
missing |
missing |
missing |
8 |
missing |
missing |
9 |
missing |
| Bowling Green |
85 |
7.08 |
0.44 |
| Western Michigan |
85 |
7.08 |
0.44 |
| Akron |
83 |
6.92 |
0.38 |
| Toledo |
88 |
6.77 |
0.32 |
| Central Michigan |
80 |
6.67 |
0.28 |
| Eastern Michigan |
75 |
6.25 |
0.12 |
| Ohio |
61 |
5.55 |
-0.15 |
| Kent State |
65 |
5.42 |
-0.20 |
| Ball State |
62 |
5.17 |
-0.30 |
| Miami (OH) |
64 |
4.92 |
-0.39 |
| Buffalo |
58 |
4.83 |
-0.42 |
| Northern Illinois |
55 |
4.58 |
-0.52 |
Mountain West
| 0 |
missing |
missing |
missing |
missing |
7 |
missing |
missing |
14 |
missing |
missing |
missing |
| 1 |
2 |
3 |
4 |
7 |
missing |
4 |
10 |
missing |
6 |
10 |
3 |
| 2 |
2 |
4 |
missing |
7 |
11 |
3 |
11 |
4 |
3 |
4 |
3 |
| 3 |
6 |
4 |
17 |
9 |
5 |
3 |
7 |
1 |
10 |
4 |
3 |
| 4 |
4 |
4 |
11 |
3 |
4 |
3 |
6 |
5 |
10 |
9 |
8 |
| 5 |
1 |
3 |
8 |
3 |
6 |
10 |
10 |
5 |
8 |
7 |
6 |
| 6 |
missing |
3 |
8 |
8 |
missing |
missing |
missing |
missing |
missing |
7 |
2 |
| 7 |
1 |
9 |
10 |
5 |
2 |
6 |
15 |
1 |
7 |
8 |
3 |
| 8 |
5 |
missing |
4 |
missing |
2 |
10 |
10 |
7 |
6 |
7 |
missing |
| 9 |
2 |
3 |
5 |
4 |
5 |
12 |
7 |
missing |
6 |
missing |
5 |
| 10 |
6 |
4 |
3 |
1 |
10 |
5 |
7 |
9 |
6 |
6 |
10 |
| 11 |
3 |
4 |
11 |
1 |
5 |
12 |
9 |
4 |
4 |
13 |
2 |
| 12 |
4 |
3 |
5 |
1 |
3 |
7 |
11 |
1 |
10 |
5 |
0 |
| 13 |
3 |
1 |
5 |
1 |
9 |
6 |
15 |
2 |
4 |
13 |
4 |
| 14 |
missing |
3 |
missing |
missing |
missing |
missing |
missing |
missing |
5 |
missing |
missing |
| New Mexico |
118 |
9.83 |
1.15 |
| Utah State |
93 |
7.75 |
0.55 |
| Colorado State |
91 |
7.58 |
0.50 |
| Nevada |
81 |
6.75 |
0.26 |
| UNLV |
85 |
6.54 |
0.20 |
| Hawai'i |
69 |
5.75 |
-0.02 |
| San Diego State |
53 |
4.82 |
-0.29 |
| Fresno State |
50 |
4.17 |
-0.48 |
| Wyoming |
49 |
4.08 |
-0.50 |
| Boise State |
48 |
3.69 |
-0.62 |
| Air Force |
39 |
3.25 |
-0.74 |
Pac-12
| 0 |
missing |
missing |
missing |
missing |
missing |
missing |
missing |
missing |
8 |
missing |
missing |
missing |
| 1 |
11 |
9 |
8 |
6 |
2 |
9 |
9 |
8 |
8 |
5 |
5 |
3 |
| 2 |
5 |
4 |
4 |
9 |
14 |
2 |
5 |
7 |
8 |
7 |
7 |
8 |
| 3 |
6 |
2 |
6 |
10 |
9 |
4 |
6 |
3 |
missing |
5 |
11 |
5 |
| 4 |
5 |
4 |
2 |
12 |
9 |
5 |
6 |
6 |
10 |
4 |
9 |
7 |
| 5 |
8 |
5 |
7 |
7 |
2 |
11 |
4 |
missing |
6 |
3 |
12 |
missing |
| 6 |
12 |
9 |
3 |
8 |
missing |
5 |
missing |
8 |
8 |
missing |
missing |
4 |
| 7 |
5 |
missing |
7 |
17 |
5 |
11 |
7 |
9 |
9 |
3 |
5 |
5 |
| 8 |
missing |
7 |
missing |
missing |
7 |
missing |
10 |
5 |
6 |
8 |
5 |
8 |
| 9 |
4 |
9 |
5 |
7 |
8 |
2 |
8 |
9 |
11 |
3 |
7 |
5 |
| 10 |
3 |
6 |
3 |
8 |
9 |
4 |
5 |
5 |
6 |
6 |
6 |
5 |
| 11 |
8 |
7 |
11 |
11 |
13 |
5 |
4 |
9 |
6 |
8 |
11 |
7 |
| 12 |
5 |
4 |
4 |
5 |
5 |
8 |
9 |
6 |
6 |
7 |
10 |
6 |
| 13 |
6 |
3 |
5 |
7 |
6 |
4 |
2 |
5 |
missing |
2 |
7 |
10 |
| 14 |
missing |
missing |
missing |
missing |
2 |
missing |
missing |
missing |
missing |
missing |
7 |
missing |
| Colorado |
107 |
8.92 |
0.82 |
| Washington |
102 |
7.85 |
0.44 |
| USC |
92 |
7.67 |
0.38 |
| Oregon |
91 |
7.00 |
0.14 |
| UCLA |
80 |
6.67 |
0.02 |
| Arizona |
78 |
6.50 |
-0.03 |
| Stanford |
75 |
6.25 |
-0.12 |
| Washington State |
73 |
6.08 |
-0.18 |
| Oregon State |
70 |
5.83 |
-0.27 |
| Arizona State |
69 |
5.75 |
-0.30 |
| California |
65 |
5.42 |
-0.42 |
| Utah |
61 |
5.08 |
-0.53 |
SEC
| 0 |
missing |
missing |
missing |
missing |
missing |
missing |
missing |
missing |
missing |
missing |
missing |
missing |
missing |
8 |
| 1 |
2 |
7 |
4 |
9 |
5 |
7 |
2 |
1 |
7 |
7 |
6 |
4 |
9 |
missing |
| 2 |
10 |
4 |
7 |
4 |
3 |
10 |
2 |
9 |
5 |
5 |
8 |
10 |
7 |
5 |
| 3 |
5 |
14 |
5 |
5 |
6 |
5 |
6 |
4 |
6 |
5 |
11 |
10 |
8 |
2 |
| 4 |
6 |
11 |
10 |
5 |
5 |
10 |
5 |
5 |
7 |
8 |
4 |
5 |
7 |
7 |
| 5 |
6 |
0 |
1 |
10 |
3 |
3 |
6 |
3 |
9 |
11 |
4 |
7 |
6 |
4 |
| 6 |
14 |
10 |
missing |
8 |
6 |
5 |
11 |
6 |
11 |
5 |
missing |
missing |
4 |
5 |
| 7 |
5 |
2 |
5 |
6 |
4 |
14 |
12 |
missing |
6 |
missing |
9 |
12 |
11 |
5 |
| 8 |
1 |
5 |
7 |
missing |
missing |
missing |
3 |
8 |
6 |
10 |
6 |
8 |
missing |
missing |
| 9 |
missing |
missing |
7 |
2 |
2 |
4 |
missing |
8 |
missing |
6 |
8 |
9 |
2 |
4 |
| 10 |
6 |
6 |
5 |
7 |
5 |
6 |
8 |
9 |
8 |
8 |
10 |
11 |
9 |
4 |
| 11 |
6 |
4 |
2 |
6 |
5 |
4 |
8 |
12 |
7 |
9 |
6 |
9 |
5 |
2 |
| 12 |
3 |
6 |
9 |
9 |
2 |
7 |
5 |
6 |
7 |
8 |
9 |
3 |
3 |
missing |
| 13 |
8 |
7 |
5 |
8 |
6 |
0 |
6 |
4 |
7 |
6 |
4 |
10 |
4 |
10 |
| 14 |
3 |
missing |
missing |
missing |
5 |
missing |
missing |
missing |
missing |
missing |
missing |
missing |
missing |
missing |
| Tennessee |
98 |
8.17 |
0.65 |
| Ole Miss |
88 |
7.33 |
0.36 |
| Missouri |
86 |
7.17 |
0.30 |
| South Carolina |
85 |
7.08 |
0.27 |
| Florida |
79 |
6.58 |
0.10 |
| Arkansas |
76 |
6.33 |
0.01 |
| Kentucky |
75 |
6.25 |
-0.02 |
| Mississippi State |
75 |
6.25 |
-0.02 |
| Texas A&M |
75 |
6.25 |
-0.02 |
| LSU |
74 |
6.17 |
-0.05 |
| Alabama |
75 |
5.77 |
-0.19 |
| Auburn |
67 |
5.58 |
-0.25 |
| Vanderbilt |
56 |
5.09 |
-0.42 |
| Georgia |
57 |
4.38 |
-0.67 |
Sun Belt
| 0 |
missing |
missing |
missing |
missing |
missing |
missing |
missing |
missing |
missing |
missing |
missing |
missing |
missing |
missing |
| 1 |
2 |
14 |
3 |
9 |
5 |
4 |
2 |
5 |
5 |
4 |
7 |
5 |
4 |
5 |
| 2 |
7 |
3 |
4 |
6 |
2 |
7 |
10 |
3 |
4 |
3 |
6 |
13 |
6 |
3 |
| 3 |
3 |
4 |
3 |
5 |
11 |
6 |
8 |
6 |
missing |
5 |
8 |
6 |
10 |
6 |
| 4 |
2 |
3 |
10 |
5 |
9 |
6 |
5 |
missing |
3 |
7 |
5 |
5 |
9 |
7 |
| 5 |
6 |
10 |
10 |
10 |
5 |
10 |
7 |
5 |
10 |
9 |
5 |
7 |
8 |
4 |
| 6 |
missing |
2 |
missing |
missing |
missing |
missing |
5 |
2 |
6 |
5 |
9 |
4 |
3 |
8 |
| 7 |
6 |
missing |
9 |
3 |
8 |
3 |
missing |
3 |
8 |
missing |
missing |
missing |
6 |
9 |
| 8 |
5 |
9 |
4 |
3 |
4 |
4 |
4 |
9 |
3 |
8 |
9 |
4 |
missing |
missing |
| 9 |
5 |
3 |
5 |
1 |
5 |
2 |
6 |
9 |
7 |
6 |
8 |
9 |
4 |
5 |
| 10 |
4 |
7 |
3 |
7 |
2 |
5 |
4 |
5 |
7 |
7 |
4 |
4 |
9 |
5 |
| 11 |
4 |
3 |
3 |
7 |
6 |
5 |
10 |
8 |
9 |
5 |
8 |
5 |
12 |
4 |
| 12 |
5 |
9 |
6 |
5 |
7 |
8 |
8 |
7 |
7 |
9 |
5 |
6 |
6 |
6 |
| 13 |
1 |
7 |
3 |
9 |
8 |
9 |
6 |
9 |
8 |
6 |
6 |
7 |
7 |
1 |
| 14 |
8 |
missing |
missing |
missing |
missing |
missing |
missing |
missing |
missing |
missing |
missing |
missing |
missing |
4 |
| Texas State |
84 |
7.00 |
0.43 |
| South Alabama |
80 |
6.67 |
0.29 |
| Marshall |
77 |
6.42 |
0.19 |
| Louisiana |
75 |
6.25 |
0.13 |
| Southern Mississippi |
75 |
6.25 |
0.13 |
| Arkansas State |
74 |
6.17 |
0.09 |
| Old Dominion |
74 |
6.17 |
0.09 |
| Georgia State |
72 |
6.00 |
0.03 |
| Louisiana Monroe |
71 |
5.92 |
-0.01 |
| Georgia Southern |
70 |
5.83 |
-0.04 |
| James Madison |
69 |
5.75 |
-0.07 |
| Coastal Carolina |
63 |
5.25 |
-0.27 |
| Troy |
67 |
5.15 |
-0.31 |
| Appalachian State |
58 |
4.46 |
-0.59 |
All FBS sorted by z-scores
| 1 |
New Mexico |
118 |
9.83 |
1.44 |
| 2 |
Colorado |
107 |
8.92 |
1.11 |
| 3 |
Tennessee |
98 |
8.17 |
0.84 |
| 4 |
UMass |
96 |
8.00 |
0.78 |
| 5 |
Washington |
102 |
7.85 |
0.72 |
| 6 |
Pittsburgh |
94 |
7.83 |
0.72 |
| 7 |
Utah State |
93 |
7.75 |
0.69 |
| 8 |
USC |
92 |
7.67 |
0.66 |
| 9 |
Colorado State |
91 |
7.58 |
0.62 |
| 10 |
Ole Miss |
88 |
7.33 |
0.53 |
| 11 |
South Florida |
88 |
7.33 |
0.53 |
| 12 |
Syracuse |
88 |
7.33 |
0.53 |
| 13 |
Missouri |
86 |
7.17 |
0.47 |
| 14 |
Bowling Green |
85 |
7.08 |
0.44 |
| 15 |
North Carolina |
85 |
7.08 |
0.44 |
| 16 |
South Carolina |
85 |
7.08 |
0.44 |
| 17 |
Western Michigan |
85 |
7.08 |
0.44 |
| 18 |
Oregon |
91 |
7.00 |
0.41 |
| 19 |
Texas State |
84 |
7.00 |
0.41 |
| 20 |
UTEP |
77 |
7.00 |
0.41 |
| 21 |
Akron |
83 |
6.92 |
0.38 |
| 22 |
Charlotte |
83 |
6.92 |
0.38 |
| 23 |
Louisiana Tech |
76 |
6.91 |
0.38 |
| 24 |
Toledo |
88 |
6.77 |
0.33 |
| 25 |
Michigan State |
81 |
6.75 |
0.32 |
| 26 |
Middle Tennessee |
81 |
6.75 |
0.32 |
| 27 |
Nevada |
81 |
6.75 |
0.32 |
| 28 |
Central Michigan |
80 |
6.67 |
0.29 |
| 29 |
Oklahoma |
80 |
6.67 |
0.29 |
| 30 |
South Alabama |
80 |
6.67 |
0.29 |
| 31 |
UAB |
80 |
6.67 |
0.29 |
| 32 |
UCLA |
80 |
6.67 |
0.29 |
| 33 |
Boston College |
79 |
6.58 |
0.26 |
| 34 |
Florida |
79 |
6.58 |
0.26 |
| 35 |
Illinois |
79 |
6.58 |
0.26 |
| 36 |
UNLV |
85 |
6.54 |
0.24 |
| 37 |
Arizona |
78 |
6.50 |
0.23 |
| 38 |
Virginia |
78 |
6.50 |
0.23 |
| 39 |
Marshall |
77 |
6.42 |
0.20 |
| 40 |
Virginia Tech |
77 |
6.42 |
0.20 |
| 41 |
New Mexico State |
83 |
6.38 |
0.19 |
| 42 |
Arkansas |
76 |
6.33 |
0.17 |
| 43 |
Florida State |
82 |
6.31 |
0.16 |
| 44 |
Liberty |
82 |
6.31 |
0.16 |
| 45 |
Texas |
82 |
6.31 |
0.16 |
| 46 |
Eastern Michigan |
75 |
6.25 |
0.14 |
| 47 |
Kentucky |
75 |
6.25 |
0.14 |
| 48 |
Louisiana |
75 |
6.25 |
0.14 |
| 49 |
Mississippi State |
75 |
6.25 |
0.14 |
| 50 |
Southern Mississippi |
75 |
6.25 |
0.14 |
| 51 |
Stanford |
75 |
6.25 |
0.14 |
| 52 |
Texas A&M |
75 |
6.25 |
0.14 |
| 53 |
Arkansas State |
74 |
6.17 |
0.11 |
| 54 |
LSU |
74 |
6.17 |
0.11 |
| 55 |
Miami |
74 |
6.17 |
0.11 |
| 56 |
Old Dominion |
74 |
6.17 |
0.11 |
| 57 |
TCU |
74 |
6.17 |
0.11 |
| 58 |
Connecticut |
73 |
6.08 |
0.08 |
| 59 |
Washington State |
73 |
6.08 |
0.08 |
| 60 |
Georgia State |
72 |
6.00 |
0.05 |
| 61 |
NC State |
72 |
6.00 |
0.05 |
| 62 |
Purdue |
72 |
6.00 |
0.05 |
| 63 |
UCF |
72 |
6.00 |
0.05 |
| 64 |
Louisiana Monroe |
71 |
5.92 |
0.02 |
| 65 |
East Carolina |
70 |
5.83 |
-0.01 |
| 66 |
Georgia Southern |
70 |
5.83 |
-0.01 |
| 67 |
Oregon State |
70 |
5.83 |
-0.01 |
| 68 |
Alabama |
75 |
5.77 |
-0.04 |
| 69 |
Louisville |
75 |
5.77 |
-0.04 |
| 70 |
Arizona State |
69 |
5.75 |
-0.04 |
| 71 |
Hawai'i |
69 |
5.75 |
-0.04 |
| 72 |
James Madison |
69 |
5.75 |
-0.04 |
| 73 |
Navy |
63 |
5.73 |
-0.05 |
| 74 |
Cincinnati |
68 |
5.67 |
-0.07 |
| 75 |
Houston |
68 |
5.67 |
-0.07 |
| 76 |
UT San Antonio |
68 |
5.67 |
-0.07 |
| 77 |
Florida International |
62 |
5.64 |
-0.08 |
| 78 |
Auburn |
67 |
5.58 |
-0.10 |
| 79 |
Duke |
67 |
5.58 |
-0.10 |
| 80 |
Rice |
67 |
5.58 |
-0.10 |
| 81 |
Texas Tech |
67 |
5.58 |
-0.10 |
| 82 |
Ohio |
61 |
5.55 |
-0.12 |
| 83 |
Indiana |
66 |
5.50 |
-0.13 |
| 84 |
Notre Dame |
66 |
5.50 |
-0.13 |
| 85 |
Ohio State |
66 |
5.50 |
-0.13 |
| 86 |
Wisconsin |
66 |
5.50 |
-0.13 |
| 87 |
California |
65 |
5.42 |
-0.16 |
| 88 |
Kent State |
65 |
5.42 |
-0.16 |
| 89 |
Northwestern |
65 |
5.42 |
-0.16 |
| 90 |
BYU |
64 |
5.33 |
-0.19 |
| 91 |
Maryland |
64 |
5.33 |
-0.19 |
| 92 |
Coastal Carolina |
63 |
5.25 |
-0.22 |
| 93 |
Jacksonville State |
57 |
5.18 |
-0.25 |
| 94 |
Ball State |
62 |
5.17 |
-0.25 |
| 95 |
Georgia Tech |
62 |
5.17 |
-0.25 |
| 96 |
Troy |
67 |
5.15 |
-0.26 |
| 97 |
Vanderbilt |
56 |
5.09 |
-0.28 |
| 98 |
Sam Houston State |
61 |
5.08 |
-0.28 |
| 99 |
Tulsa |
61 |
5.08 |
-0.28 |
| 100 |
Utah |
61 |
5.08 |
-0.28 |
| 101 |
Iowa State |
60 |
5.00 |
-0.32 |
| 102 |
Nebraska |
60 |
5.00 |
-0.32 |
| 103 |
Oklahoma State |
65 |
5.00 |
-0.32 |
| 104 |
Rutgers |
60 |
5.00 |
-0.32 |
| 105 |
Tulane |
65 |
5.00 |
-0.32 |
| 106 |
Miami (OH) |
64 |
4.92 |
-0.34 |
| 107 |
Penn State |
59 |
4.92 |
-0.35 |
| 108 |
Buffalo |
58 |
4.83 |
-0.38 |
| 109 |
Clemson |
58 |
4.83 |
-0.38 |
| 110 |
San Diego State |
53 |
4.82 |
-0.38 |
| 111 |
Kansas State |
57 |
4.75 |
-0.41 |
| 112 |
North Texas |
57 |
4.75 |
-0.41 |
| 113 |
West Virginia |
57 |
4.75 |
-0.41 |
| 114 |
Kansas |
55 |
4.58 |
-0.47 |
| 115 |
Northern Illinois |
55 |
4.58 |
-0.47 |
| 116 |
Temple |
54 |
4.50 |
-0.50 |
| 117 |
Western Kentucky |
54 |
4.50 |
-0.50 |
| 118 |
Appalachian State |
58 |
4.46 |
-0.51 |
| 119 |
SMU |
58 |
4.46 |
-0.51 |
| 120 |
Memphis |
53 |
4.42 |
-0.53 |
| 121 |
Georgia |
57 |
4.38 |
-0.54 |
| 122 |
Fresno State |
50 |
4.17 |
-0.62 |
| 123 |
Baylor |
49 |
4.08 |
-0.65 |
| 124 |
Wake Forest |
49 |
4.08 |
-0.65 |
| 125 |
Wyoming |
49 |
4.08 |
-0.65 |
| 126 |
Army |
42 |
3.82 |
-0.75 |
| 127 |
Boise State |
48 |
3.69 |
-0.79 |
| 128 |
Iowa |
46 |
3.54 |
-0.85 |
| 129 |
Florida Atlantic |
41 |
3.42 |
-0.89 |
| 130 |
Air Force |
39 |
3.25 |
-0.95 |
| 131 |
Minnesota |
36 |
3.00 |
-1.04 |
| 132 |
Michigan |
38 |
2.92 |
-1.07 |
Data: @CFB_Data or collegefootballdata.com
FanPosts are just that; posts created by the fans. They are in no way indicative of the opinions of SBN and the authors of Roll Bama Roll.
Loading comments...